# Sentio
> Sentio is developer-first, AI-powered Web3 data infrastructure. Index on-chain data with TypeScript processors or hosted subgraphs, query it with SQL, build dashboards, alerts and API endpoints on it, and debug or simulate transactions, across EVM chains, Aptos, Sui, IOTA, Solana, Bitcoin, Fuel and more.
Sentio is building a decentralized data and compute network. The hosted platform runs at https://app.sentio.xyz, and the documentation at https://www.sentio.xyz/docs publishes its own llms.txt.
- To write a processor, query indexed data or call the REST API, start from the documentation links below; the product pages on this site are overviews.
- Processors are written with the `@sentio/sdk` npm package and deployed with the `sentio` CLI.
- Sentio Connect is an MCP server that gives AI assistants read access to a user's wallets, balances and DeFi positions.
## Docs
- [Documentation index](https://www.sentio.xyz/docs/llms.txt): llms.txt listing every documentation page
- [Full documentation](https://www.sentio.xyz/docs/llms-full.txt): The complete documentation as a single markdown file
- [Getting Started](https://www.sentio.xyz/docs/quickstart): Create, build and deploy a first processor
- [Sentio Processor](https://www.sentio.xyz/docs/processor-engine): How processors are configured, run and managed
- [Hosted Subgraphs](https://www.sentio.xyz/docs/hosted-subgraphs): Run The Graph subgraphs on Sentio
- [Supported Networks](https://www.sentio.xyz/docs/supported-network)
- [Data Studio](https://www.sentio.xyz/docs/data-studio): Query metrics, event logs and entities with SQL and build dashboards
- [Alerts](https://www.sentio.xyz/docs/alerts)
- [Endpoint](https://www.sentio.xyz/docs/endpoint): Turn SQL or GraphQL into REST API endpoints
- [Debugger](https://www.sentio.xyz/docs/debugger-overview)
- [AI Skills](https://www.sentio.xyz/docs/ai-skills): Agent skills for building processors and using the platform
- [Sentio Connect](https://www.sentio.xyz/docs/connect): Add wallets and DeFi positions to Claude, ChatGPT, Codex or any MCP client
- [CLI Reference](https://www.sentio.xyz/docs/cli-reference)
- [API Reference](https://www.sentio.xyz/docs/reference): The Sentio REST API
## Products
- [Network](https://www.sentio.xyz/): The decentralized data and compute network
- [Platform](https://www.sentio.xyz/platform/): Unified observability platform
- [Indexer](https://www.sentio.xyz/indexer/): Up to 5x faster indexing, with one-click subgraph migration
- [Analytics](https://www.sentio.xyz/analytics/): Historical and real-time analytics
- [Alerts](https://www.sentio.xyz/alerts/): Alerts delivered to your preferred channels
- [Debugger](https://www.sentio.xyz/debugger/): Inspect every detail of a transaction and debug it with single-stepping
- [Simulator](https://www.sentio.xyz/simulator/): Preview transaction results, 3x-10x faster
- [Code Intelligence](https://www.sentio.xyz/code/): Fast code search with all the context you need
- [Collaboration](https://www.sentio.xyz/collaboration/): Built for teams
- [Integration](https://www.sentio.xyz/integration/): Chrome extension, Hardhat plugin and more
- [Connect](https://www.sentio.xyz/connect/): Bring wallets, positions and transactions into any MCP-compatible AI agent
- [Point Tracking](https://www.sentio.xyz/solution/point/): Track points and rewards programs
- [Chain Support](https://www.sentio.xyz/solution/chain/): Sentio for chain ecosystems
## Blog
The full text of every post on https://www.sentio.xyz/blog/, newest first.
---
# OBIB: An Open Blockchain Indexer Benchmark — Workloads, Methodology, and Initial Results
Source: https://www.sentio.xyz/blog/obib-open-blockchain-indexer-benchmark/
Published: 2026-05-22
Description: A standardized, open benchmark for blockchain indexers — events, RPC-augmented events, blocks, transactions, traces, and factory templates — verified for completeness and run on a unified RPC endpoint.
A growing number of platforms — Sentio, Envio HyperIndex, Ponder, Subsquid, The Graph, and others — offer indexing infrastructure for on-chain data, differing in execution model, API surface, supported data categories, and completeness guarantees. Yet there is no shared methodology for comparing them: existing benchmarks measure a single workload (commonly Uniswap swap events), run on different infrastructure, and rarely verify data completeness.
This article introduces **OBIB (Open Blockchain Indexer Benchmark)**: standardized workloads spanning events, RPC-augmented events, blocks, transactions, traces, and factory templates, each verified against expected record counts and executed against a unified RPC endpoint. Methodology, configurations, and data are open on [GitHub](https://github.com/sentioxyz/open-blockchain-indexer-benchmark). We report initial results on six platforms below, and invite the community to extend OBIB to additional platforms, workloads, and chains.
## The Problem With Existing Benchmarks
Envio's 2023 benchmark showed [9.67-minute sync times for Uniswap V3 events — 2x faster than Subsquid, 80x faster than Ponder, 100x faster than The Graph](https://docs.envio.dev/blog/indexer-benchmarking-results). Subsquid has their own numbers claiming [200x faster than The Graph](https://medium.com/subsquid/indexing-uniswap-v3-with-subsquid-vs-the-graph-first-impressions-68a5216d107b). Ponder claims 10x faster than Graph Node. Ormi Labs published rankings with Ormi at number one.
Every vendor wins their own benchmark. The problems are always the same:
- **One test case.** Usually event processing. Nobody tests blocks, transactions, or traces.
- **No completeness checks.** Nobody asks "did you get all the data?"
- **Mixed infrastructure.** Cloud vs local, different RPC providers, different hardware. Impossible to compare across studies.
When Envio forked our earlier benchmark repo to add their results, they mixed HyperSync (a raw data extraction engine) times with full indexer times — comparing a data dump tool against platforms that parse, transform, store, and serve data through APIs. That comparison made it into their marketing materials.
## What We Tested
Six cases on Ethereum mainnet. Each one isolates a different capability.
| Case | Data Type | Block Range | Expected Records | What It Tests |
| ------ | ------------- | ------------------------- | ---------------- | --------------------------------------------------- |
| Case 1 | Events | 0 → 22,200,000 | 294,278 | LBTC transfers. No RPC calls. Write-only. |
| Case 2 | Events + RPC | 22,400,000 → 22,500,000 | 7,634 | Events with RPC calls and read-after-write. |
| Case 3 | Blocks | 0 → 100,000 | 100,001 | Raw block data. Metadata extraction. |
| Case 4 | Transactions | 22,280,000 → 22,290,000 | 1,696,641 | Gas usage across ~1.7M transactions. |
| Case 5 | Traces | 22,200,000 → 22,290,000 | 50,191 | Internal call traces. Hardest to get right. |
| Case 6 | Templates | 19,000,000 → 19,010,000 | 35,039 | Uniswap V2 factory pattern. Dynamic contract registration. |
Six platforms:
- **Sentio** — cloud-hosted, native indexing with SQL and cross-chain support (SDK 3.1.0)
- **Envio HyperIndex** — local, Docker-based indexing framework with GraphQL (v2.32.3)
- **Ponder** — local, Node.js framework for blockchain data APIs (v0.16.1)
- **Subsquid (SQD)** — local, batch-processing framework with decentralized data network (v1.27.3)
- **Subgraph (The Graph Studio)** — cloud-hosted on Graph Studio infrastructure (graph-cli v0.97.0)
- **Sentio Subgraph** — same Subgraph runtime, Sentio's infrastructure. Same code, different infra. Included to isolate the infrastructure variable.
### Methodology
All local platforms used Sentio's RPC service. This is the biggest methodological improvement over previous benchmarks — everyone gets the same RPC.
Local tests ran on a MacBook Air M3 (24 GB RAM). Cloud platforms (Sentio, Subgraph, Sentio Subgraph) ran on their own infrastructure. This means cloud platforms pay network latency that local platforms don't. We kept it this way because that's how people actually use these tools — nobody self-hosts The Graph Studio, nobody deploys Ponder to a cloud.
72-hour timeout per test. Sentio ran 5 iterations per case with anomaly exclusion. Other platforms ran single iterations.
## Event Indexing (Cases 1 and 2)
Case 1 is the test every benchmark runs. Case 2 is the test that actually matters — events plus RPC calls plus read-after-write, which is what production indexers do.
### Case 1: Events Only
| Platform | Time (min) | Records |
| ---------------- | ---------- | --------- |
| Envio HyperIndex | 6.94 | 294,278 |
| Sentio | 11.02 | 294,278 |
| Sentio Subgraph | 14.90 | 294,278 |
| Ponder | 34.80 | 294,278 |
| Subsquid | 40.94 | 294,278 |
| Subgraph | 188.79 | 294,278 |
Envio wins. All platforms returned correct data. Not much to say here — this is table stakes.
### Case 2: Events + RPC Calls
| Platform | Time (min) | Records |
| ---------------- | ---------- | ------- |
| Sentio | 7.78 | 7,634 |
| Envio HyperIndex | 8.54 | 7,634 |
| Sentio Subgraph | 29.23 | 7,634 |
| Subsquid | 46.85 | 7,634 |
| Ponder | 64.86 | 7,634 |
| Subgraph | 66.41 | 7,634 |
Add RPC calls and the rankings change. Sentio edges ahead at 7.78 minutes, Envio close behind at 8.54. Everyone else is 29 minutes or more.
This is the more useful test. In production you're almost always fetching balances, computing derived values, or reading contract state while processing events. Pure event throughput is a different skill than handling that full workload.
All platforms returned correct data for both cases.
## Beyond Events (Cases 3, 4, and 5)
Most indexers were built for events. Here's what happens when you need something else.
### Case 3: Blocks
| Platform | Time (min) | Records | Completeness |
| ---------------- | ---------- | ------- | -------------- |
| Subsquid | 0.17 | 100,001 | 100% |
| Sentio | 2.51 | 100,001 | 100% |
| Sentio Subgraph | 2.67 | 100,001 | 100% |
| Ponder | 9.63 | 100,001 | 100% |
| Subgraph | 50.58 | 100,001 | 100% |
| Envio HyperIndex | N/A | — | Not supported |
Subsquid: 10 seconds, complete data. Clearly the fastest here. Everyone who supports blocks got 100%.
One thing we learned the hard way: Subsquid's `.addTransaction()` method silently skips blocks with no transactions. Early Ethereum (blocks 0–46,000) is mostly empty blocks, so using the wrong API call drops ~87% of the range without any warning. The correct method is `.includeAllBlocks()`. We burned time debugging this before figuring it out — worth knowing if you're writing a Subsquid block indexer.
Envio HyperIndex can't do blocks natively. HyperSync can (see below), but you'd be building the pipeline yourself.
### Case 4: Transactions
| Platform | Time (min) | Records | Completeness |
| ---------------- | ---------- | --------- | --------------------- |
| Subsquid | 1.25 | 1,696,641 | 100% |
| Sentio | 22.12 | 1,696,641 | 100% |
| Ponder | Timeout | — | 2.5% after 2 hours |
| Envio HyperIndex | N/A | — | Not supported |
| Subgraph | N/A | — | Not supported |
| Sentio Subgraph | N/A | — | Not supported |
Two platforms finished. Subsquid handled 1.7 million transactions in 1.25 minutes — genuinely impressive for a local setup. Sentio took 22 minutes from the cloud. Ponder made it to 2.5% in two hours and we stopped it. Three platforms can't process transactions at all.
### Case 5: Traces
This is where it gets interesting.
| Platform | Time (min) | Records | Completeness |
| ---------------- | ---------- | ------- | ------------- |
| Sentio Subgraph | 2.17 | 45,895 | 91% |
| Sentio | 2.54 | 50,191 | 100% |
| Subsquid | 7.42 | 50,191 | 100% |
| Subgraph | 17.81 | 29,058 | 58% |
| Ponder | 74.71 | 44,400 | 88% |
| Envio HyperIndex | N/A | — | Not supported |
Expected: 50,191 traces. Sentio and Subsquid got all of them. Sentio Subgraph got 91%. Ponder got 88%. Subgraph got 58%.
That Subgraph number deserves an explanation. Subgraph uses `callHandlers`, which only see direct calls to a contract. When a user wallet calls the Uniswap V2 Router, Subgraph sees it. When an aggregator or MEV bot calls the router through an intermediary contract — an internal transaction — Subgraph doesn't. About 40% of V2 swaps happen that way. This also breaks sender identification: Subgraph found ~427 unique senders where trace-based indexers found ~1,200, because `call.from` returns the calling contract, not the original wallet. This isn't a config issue — it's how the Subgraph runtime works.
### A note on Envio HyperSync
Envio offers HyperSync, a raw data extraction engine. No schema management, no database, no GraphQL — just raw blockchain data. It's fast:
| Case | HyperSync Time | Records |
| --------------------- | -------------- | --------- |
| Case 3 (blocks) | 3.19 s | 100,001 |
| Case 4 (transactions) | 128.64 s | 1,696,423 |
| Case 5 (traces) | 33.84 s | 50,191 |
But comparing these to indexer times is apples to oranges. HyperSync gives you raw data. You still need to decode it, transform it, store it, and serve it. That's the part that takes time.
## Templates and the Counting Problem (Case 6)
Uniswap V2, SushiSwap, most AMMs — they all use factory contracts that deploy pair contracts dynamically. Indexers need to detect new contracts on the fly and start tracking them.
| Platform | Time (min) | Records | vs Expected: 35,039 |
| ---------------- | ---------- | ------- | ------------------- |
| Envio HyperIndex | 1.92 | 35,039 | ✓ |
| Sentio Subgraph | 4.26 | 75,951 | 2.2x |
| Subsquid | 5.34 | 33,972 | 97% |
| Ponder | 6.44 | 182,767 | 5.2x |
| Sentio | 14.36 | 75,951 | 2.2x |
| Subgraph | 16.83 | 35,039 | ✓ |
Envio is fastest. But the record counts are all over the place.
Expected: 35,039. Envio and Subgraph match. Subsquid is close at 33,972. Then Sentio reports 75,951 and Ponder reports 182,767. Same contracts, same block range, wildly different counts.
This isn't a bug in any platform. There's simply no standard for what "count the template events" means. Some platforms count only events from dynamically created contracts. Others include factory events. Others count differently when one transaction fires events across multiple related contracts. Until the industry agrees on a methodology, these numbers aren't directly comparable.
One operational note: Subsquid's template support requires you to manually update config at fixed block numbers when new contracts are created. Fine for a handful of contracts. Not practical if your factory creates thousands.
## Feature Support
The feature matrix matters more than any speed number. If a platform can't do what you need, it doesn't matter how fast it is.
| Feature | Sentio | Envio | Ponder | Subsquid | Subgraph |
| -------------------- | ------ | ------- | ------ | -------- | -------- |
| Event Handler | Yes | Yes | Yes | Yes | Yes |
| Block Handler | Yes | Limited | Yes | Yes | Yes |
| Transaction Handler | Yes | Limited | Yes | Yes | No |
| Trace Handler | Yes | Limited | No | Limited | Limited |
| Native RPC Calls | Yes | Limited | No | No | No |
| SQL Querying | Yes | Yes | Yes | Yes | No |
| GraphQL API | Yes | Yes | Yes | No | Yes |
| Factory Templates | Yes | Yes | Yes | Limited | Yes |
| Batch RPC (Multicall)| Yes | Yes | Yes | Yes | No |
"Limited" means:
- **Envio:** Blocks/transactions/traces require HyperSync + manual decoding + client-side reorg handling. Not native to HyperIndex.
- **Subsquid:** Traces come as raw bytes. You decode them yourself.
- **Subsquid:** Templates need manual config updates at fixed blocks.
- **Subgraph:** Traces only capture direct contract calls. Internal transactions are invisible (~58% capture rate, broken sender identification).
### Chain Support
| Chain | Sentio | Envio | Ponder | Subsquid | Subgraph |
| -------- | ------- | ----- | ------ | -------- | -------- |
| EVM | Yes | Yes | Yes | Yes | Yes |
| Sui | Yes | — | — | — | — |
| Aptos | Yes | — | — | — | — |
| Fuel | Yes | Yes | — | Yes | — |
| Solana | Limited | — | — | Yes | Limited |
| Bitcoin | Limited | — | — | — | Yes |
Sentio has the widest coverage. Subsquid and Subgraph each cover a few non-EVM chains. Envio and Ponder are EVM-only.
## What Should You Use?
Depends on what you're building.
- **Event indexing, speed matters most:** Envio. Fastest in Case 1 by a clear margin. Requires Docker locally.
- **Events with RPC calls and complex logic:** Sentio and Envio are within a minute of each other in Case 2. Pick based on other factors — chain support, infrastructure preference, whether you want managed or self-hosted.
- **Blocks, transactions, or traces:** Sentio is the only platform that handles all three natively with complete data. Subsquid is strong on blocks and transactions but traces require manual decoding. Subgraph has a 58% capture rate on traces — if your app needs trace data, that's a dealbreaker.
- **Multi-chain:** Sentio. Nobody else covers EVM + Sui + Aptos + Fuel.
- **Biggest ecosystem:** The Graph. Thousands of existing subgraphs, mature tooling, large developer community. The Subgraph standard is the closest thing this space has to an industry standard. Slower sync, but the ecosystem has real value.
- **Self-hosted with minimal setup:** Ponder. Plain Node.js, no Docker. The team joined Monad in February 2026, so the project's future direction may tilt toward Monad-specific work.
- **Already on Subgraph, want it faster:** Sentio Subgraph. Same runtime, different infrastructure. Case 1 went from 188 minutes to 14 minutes. No code changes.
## The Point
We need better benchmarks. Not just faster-than-thou blog posts with one test case and a bar chart.
We're publishing everything — methodology, data, source code — so anyone can verify or challenge these results. The [code and data is on GitHub](https://github.com/sentioxyz/open-blockchain-indexer-benchmark).
If we got a configuration wrong, open a PR. If you can make one of these platforms perform better, show us. That's how this should work.
---
*Benchmark data collected January 2026. Source code and data at [github.com/sentioxyz/open-blockchain-indexer-benchmark](https://github.com/sentioxyz/open-blockchain-indexer-benchmark).*
---
# From Transaction to Dashboard: A Developer’s Guide to Monitoring IOTA
Source: https://www.sentio.xyz/blog/from-transaction-to-dashboard-a-developers-guide-to-monitoring-iota/
Published: 2025-09-03
If you're here, you've probably already decided to build on IOTA. You were drawn in by its powerful Move VM, its focus on real-world assets, and its incredible performance. But now your smart contracts are deployed, and you're facing the big question: **what's actually happening inside them?**
When you're dealing with everything from complex DeFi protocols to enterprise-grade logistics, just "shipping it" isn't enough. You need to see everything—performance bottlenecks, user activity, and especially that one weird transaction that failed for no apparent reason.
This guide is your practical walkthrough for getting that deep visibility. We'll show you how to use Sentio, a monitoring platform designed specifically for Move-based chains like IOTA, to go from flying blind to having a complete mission control for your DApp.
## **What Makes IOTA Special? A Quick Refresher**
Before we dive into the "how," let's quickly recap the "why." IOTA isn't just another Layer 1; its new architecture combines several key innovations that make it unique.
- **Move VM at the Core**: IOTA utilizes the Move VM for exceptionally secure and efficient Layer 1 smart contracts. Its design treats digital assets like physical objects, inherently preventing common token vulnerabilities.
- **Lightning-Fast Consensus**: The network’s delegated Proof-of-Stake (dPoS) system achieves finality in under a second and handles over 50,000 transactions per second. With up to 150 validator slots, it’s built for genuine decentralization.
- **Smart Tokenomics**: IOTA has a balanced economic model designed for sustainability. It mints new tokens to reward participants and burns transaction fees to counteract inflation.
- **The Best of Both Worlds (Dual-Layer):** A dual-layer system gives developers ultimate flexibility. They can use high-performance Move on Layer 1 or familiar EVM-compatible chains on Layer 2 without compromise.
- **A Focus on the Real World**: IOTA is dedicated to enterprise adoption with tangible projects like the Trade Worldwide Information Network (TWIN). It partners with major organizations to tokenize real-world assets like global trade.
Whether you're building for DeFi or digitizing trade finance, IOTA provides the foundation. Now, let's make sure you have the tools to monitor everything you build on it.
## **1. First, Let's Get the Data: Indexing IOTA's Move Architecture**
Before you can analyze anything, you need a clean, reliable stream of data. IOTA's Move-based contracts generate a ton of it—object changes, events, resource transfers—and you need a way to capture it all without the headache of running your own infrastructure.
Sentio’s indexing engine is purpose-built for Move. It understands objects, resources, and events right out of the box.
Let's see this in action with a real-world example: building a dashboard to monitor IOTA's validators. We want to track every time someone stakes, and we also want to get performance reports for each validator at the end of an epoch.
It only takes a few lines to start listening to the core validator contracts:
```typescript
import { validator, validator_set } from '@sentio/sdk/iota/builtin/0x3'
import { IotaNetwork } from '@sentio/sdk/iota'
// First, let's watch for anyone staking with a validator
validator.bind({
network: IotaNetwork.MAIN_NET,
startCheckpoint: 1000000n
}).onEventStakingRequestEvent(
async (evt, ctx) => {
// We get fully-typed data right from the event
const { validator_address, staker_address, amount } = evt.data_decoded;
const scaledAmount = amount.scaleDown(9); // IOTA uses 9 decimals
// Log the raw event for later analysis
ctx.eventLogger.emit('stake_action', {
action: 'stake',
amount: scaledAmount,
validator: validator_address,
delegator: staker_address,
});
// And update some real-time metrics for our dashboard
ctx.meter.Counter('total_stakes').add(1, { validator: validator_address });
ctx.meter.Counter('staking_volume').add(scaledAmount, { validator: validator_address });
},
{ allEvents: true } // Process events from all validator objects
);
// Next, let's grab the performance report for each validator every epoch
validator_set.bind({ network: IotaNetwork.MAIN_NET }).onEventValidatorEpochInfoEventV1(
async (evt, ctx) => {
const { validator_address, stake, voting_power, performance_score } = evt.data_decoded;
// We'll use Gauge metrics here since these values can go up or down
ctx.meter.Gauge('validator_stake').record(stake.scaleDown(9), { validator: validator_address });
ctx.meter.Gauge('validator_voting_power').record(voting_power, { validator: validator_address });
ctx.meter.Gauge('validator_performance_score').record(performance_score, { validator: validator_address });
},
{ allEvents: true }
);
```
Just like that, we're pulling in crucial network health data. You can find the [Just like that, we're pulling in crucial network health data. You can find the **full source code on GitHub**. The same pattern works for any DApp you build—DeFi, gaming, enterprise, you name it.](https://github.com/sentioxyz/sentio-processors/tree/main/iota/validator)
## **2. A Saner Way to Code: The Type-Safe SDK**
Working with raw blockchain data can feel like a guessing game. Is that amount field a u64 or a u128? Did I spell that event name correctly?
Sentio’s SDK is designed to eliminate that guesswork. When you point it at your Move module's ABI, it automatically generates TypeScript interfaces for all your events, functions, and resources. This means you get full autocompletion in your IDE and the compiler will catch your typos, not your users.
```typescript
// Imagine this is from your own custom DEX module on IOTA
import { dex } from './types/iota/0xYourPackage.dex'
dex.bind({
network: IotaNetwork.MAIN_NET,
startCheckpoint: 1000000n
}).onEventSwapEvent(async (evt, ctx) => {
// No more guesswork! The `evt.data_decoded` object is fully typed.
const { amount_in, amount_out, user } = evt.data_decoded;
// Your IDE knows the type of amount_in, amount_out, and user.
});
```
And depending on what you need to track, Sentio gives you a few different tools for the job:
- **IotaObjectProcessor**: Need to watch one *specific* object? Use this.
- **IotaObjectTypeProcessor**: Want to track *every* object of a certain type, like all NFT listings across the entire network? This is your go-to.
- **IotaAddressProcessor**: Want to see all the transactions and objects associated with a specific address? Here you go.
## **3. What Can You Do With the Data? Turning It Into Insights**
Collecting data is one thing; making it useful is another. Sentio gives you several ways to shape your indexed data into actionable insights.
- **Metrics:** These are your numbers, the vital signs of your DApp. They're perfect for tracking things like transaction volume, daily active users, or the TVL in your protocol. Metrics power dashboards and alerts, giving you a high-level view at a glance.
```typescript
// Examples of different metrics you could track
ctx.meter.Counter('user_transactions').add(1, { user_type: 'enterprise' });
ctx.meter.Gauge('active_objects').record(object_count);
```
- **Event Logs:** This is the detailed story of your DApp. Think of it as a perfectly structured, human-readable log of everything that happens. It's invaluable for debugging or analyzing specific user journeys.
```typescript
// Log rich data for every validator epoch report
ctx.eventLogger.emit('validator_epoch_info', {
validator: validator_address,
stake,
voting_power,
performance_score
});
```
- **Entities:** This lets you store and query the relationships between things in your DApp. By using entity store, you now have the capability to organize your data based on a predefined schema. This structured data can be accessed during the processor's execution and can also be retrieved using our SQL and GraphQL APIs.
## **4. Your Mission Control: The Data Studio**
You've done the hard work of collecting and processing your data. Now for the fun part: seeing it come to life. You shouldn't need a data science degree or a front-end team to build a powerful dashboard.
With Sentio's Data Studio, any metric you created in your code instantly becomes available to visualize. Better yet, you can write SQL to query your Event Logs and build incredibly detailed analytics.
Let's take our validator data from Step 1 and ask some real questions:
**"Which validators are earning the most?"**
```sql
-- Top performing validators by rewards
SELECT
validator,
SUM(pool_staking_reward) as total_rewards
FROM validator_epoch_info
WHERE timestamp >= NOW() - INTERVAL '30 days'
GROUP BY validator
ORDER BY total_rewards DESC
LIMIT 20;
```
**"Validatos’ staking activities"**
```sql
SELECT
DATE_TRUNC('hour', timestamp) AS hour_timestamp,
SUM(CASE WHEN action = 'stake' THEN amount ELSE 0 END) as staked,
SUM(CASE WHEN action = 'unstake' THEN ABS(amount) ELSE 0 END) as unstaked
FROM `stake_action`
WHERE validator = $validator
AND timestamp >= CURRENT_TIMESTAMP() - INTERVAL '7' DAY
GROUP BY hour_timestamp
ORDER BY hour_timestamp
```
You can build dashboards to answer almost any question, from user retention in your DeFi app to asset flows in a logistics platform. And, you can set up alerts to ping you on Slack or Telegram if something looks off, like a validator's performance suddenly dropping.

You can explore the project on the[ live validator dashboard](https://app.sentio.xyz/iota/iota-validator/dashboards//b4GEIwp5).
**Beyond Your Custom Data: Ready-to-Use IOTA Datasets**
But here's where it gets even better: you don't have to build everything from scratch. Sentio provides a comprehensive set of IOTA datasets right out of the box through the **Schema Panel**:
- **balance_changes**: Track how token balances shift across addresses
- **events**: Access all emitted events from smart contracts
- **move_calls**: See every function call made to Move modules
- **object_changes**: Monitor state changes to IOTA objects
- **transactions**: Complete transaction data with full context
These aren't just raw blockchain dumps—they're clean, structured datasets that Sentio maintains and continuously updates. Think of them as your analytics foundation, ready to query without any preprocessing headaches.
## **5. Why Did My Transaction Fail? Debugging Move with a Tracer**
We’ve all been there. A transaction mysteriously fails, and you're left staring at a transaction hash, wondering what went wrong.
Sentio's Transaction Tracer is like a super-powered debugger for your DApp. It gives you a complete, step-by-step replay of the entire transaction, showing you:
- **The Full Call Stack:** Trace the flow of logic through every function call, even across different modules.
- **Gas Usage Analysis**: The debugger shows resource consumption patterns and state changes, helping you identify performance bottlenecks.
This turns debugging from a frustrating guessing game into a precise, analytical process.


## **6. Dedicated RPC Nodes**
Sentio provides high-performance RPC endpoints for both IOTA mainnet and testnet, giving you fast, reliable access to query object states, read historical data, and subscribe to real-time object changes—all without the hassle of building and maintaining your own nodes.
**What You Get from Sentio RPC**
- **Complete Historical Data**: Every transaction, every state change, from day one. Whether you're debugging something that happened last week or analyzing trends over months, it's all there.
- **Real-Time Monitoring**: Built-in dashboards show you exactly what's happening. Request latency, throughput, error rates—you'll spot issues before your users do.
- **Always Available**: Distributed infrastructure means your calls get through, even when things get busy. No more wondering if your RPC provider is the bottleneck.
**Two Options to Fit Your Needs**
Sentio offers two types of RPC nodes:
- **Public Nodes**: Free access with rate limits—perfect for development and testing.
- Mainnet: [https://rpc.sentio.xyz/iota](https://rpc.sentio.xyz/iota)
- Testnet: [https://rpc.sentio.xyz/iota-testnet](https://rpc.sentio.xyz/iota-testnet)
- **Archive Nodes**: Pay-as-you-go pricing with full historical access and no rate limits—ideal for production applications that need complete blockchain data.
**Ready to Build on IOTA?**
IOTA's Move VM and dual-layer architecture open up a world of possibilities. With the right tools, you can focus on building innovative applications instead of wrestling with observability challenges. Sentio gives you the complete monitoring stack you need to build with confidence.
- **Start Building:** [**Start Building:** Create your free Sentio account and deploy your first IOTA processor.](https://app.sentio.xyz/)
- **Check out the Docs:** Dive deeper with[**Check out the Docs:** Dive deeper with our comprehensive documentation.](https://www.sentio.xyz/docs)
- **Join the Community:** [**Join the Community:** Connect with our team and other IOTA developers.](https://t.me/sentioxyz)
---
# Monitoring, Debugging, and Scaling Aptos DApps with Sentio
Source: https://www.sentio.xyz/blog/monitoring-debugging-and-scaling-aptos-dapps-with-sentio/
Published: 2025-07-07
Description: A guide for Aptos DApp developers to monitor, debug, and scale using Sentio. Covers data indexing, analytics, debugging, RPC nodes, and data analysis for the full development workflow.
So, you're building on Aptos? Smart move. As the ecosystem grows, developers need solid tools to monitor, debug, and scale their DApps. Sentio provides exactly that.
This guide breaks down how Sentio supports your entire Aptos development workflow, from initial data collection to production monitoring.
## **What Makes Aptos Special**
[Aptos](https://aptosfoundation.org/) has a lot going for it. Built from Meta's [Diem project](https://en.wikipedia.org/wiki/Diem_(digital_currency)), it's designed around the [Move](https://move-language.github.io/move/) programming language with its resource-based model that makes asset management safer by design, making it naturally harder to create bugs like re-entrancy or double-spends. The parallel execution engine (Block-STM) processes transactions concurrently, meaning your DApp can handle more users without slowing down.
These features make Aptos a great choice for complex DeFi protocols and high-throughput applications. However, every blockchain project needs the right tools to get the job done.
Whether you are debugging transaction failures for a high-throughput application, tracking TVL for a DeFi protocol, analyzing user retention for an NFT marketplace, or auditing contract interactions as a security researcher, this guide provides the tools you need.
## **The Complete Sentio Platform for Aptos**
We've built Sentio to take the infrastructure headaches off your plate. Here's how each component fits into your workflow.
**Understanding Sentio's Approach: Event-Driven Data Processing**
Before diving into specific tools, it's helpful to understand how Sentio works. Raw blockchain data is like a fast-flowing river—there's a massive amount of information, but most of it isn't relevant to your specific project. Sentio helps you capture exactly the data you need and turn it into something you can actually use.
At the core of Sentio is the **Processor**—a TypeScript program you write that defines:
- **What to watch**: Which smart contracts or blockchain activities to monitor
- **How to react**: What to do when specific **occurrences** happen (like a swap, transfer, or state change)
- **What to output**: What to record for downstream data analysis
Sentio uses an **event-driven architecture**. Your code doesn't run constantly; instead, it "wakes up" when something interesting happens on-chain. When a transaction matches your criteria, Sentio automatically triggers your processing logic with the relevant data.
This approach is both fast and saves you a ton of work—you get a clear picture of what's happening in real-time without managing complex infrastructure.
**1. Data Indexing Across Mainnet and Testnet**
Before you can analyze anything, you need a steady stream of blockchain data. Sentio provides production-grade indexers for both Aptos Mainnet and Testnet.
This means you can develop and test on Testnet, then deploy to Mainnet using identical code. No infrastructure management, no scaling headaches, no data consistency issues.
Setting up data collection is straightforward:
```typescript
import { AptosModulesProcessor, AptosNetwork } from "@sentio/sdk/aptos";
AptosModulesProcessor.bind({
address: '0x123...abc', // Your module address
network: AptosNetwork.MAINNET, // Or AptosNetwork.TESTNET
startVersion: 1000000n
})
```
**2. Flexible Analytics with the Sentio SDK**
Now that you understand the event-driven approach, let's look at the several processor types available for Aptos. Each is built for different monitoring patterns:
**AptosModulesProcessor** - Binds to a specific Aptos module (smart contract) address. Use this to process events, function calls, and resource changes originating from or related to that module.
**AptosGlobalProcessor** - Network-wide analytics
Great for broader market analysis. Track daily active users across all DeFi protocols, monitor gas usage patterns, or analyze cross-protocol interactions.
**AptosResourcesProcessor** - State change tracking
This is your go-to for tracking account balances, NFT ownership changes, or any resource-based state that changes over time.
**Type-Safe Development Experience**
The SDK auto-generates TypeScript interfaces for any Aptos module you work with. You get full IDE support with auto-completion and compile-time type checking.
We also include pre-built interfaces for core Aptos modules:
- **Aptos Framework (0x1)**: Direct access to coin operations, including DepositEvent and WithdrawEvent
- **Aptos Token (0x3)**: Legacy token standard support
- **Aptos Digital Assets (0x4)**: Current token_object standard for NFT projects
Check out how simple it is to track an AddStateEvent for a validator:
```typescript
import { AptosNetwork, AptosContext } from "@sentio/sdk/aptos";
import { stake } from "@sentio/sdk/aptos/builtin/0x1";
const START_VERSION="100000n";
const VALIDATOR_POOL_ADDRESS = "0x123...abc" // a validator address
stake.bind({
network: AptosNetwork.MAIN_NET,
startVersion: START_VERSION,
})
// Track stake addition events
.onEventAddStakeEvent(
async (event: any, ctx: AptosContext) => {
const eventData = event.data_decoded;
if (eventData.pool_address === VALIDATOR_POOL_ADDRESS) {
// Scale down stake amount to correct decimal places
const amountAdded = eventData.amount_added.scaleDown(8);
ctx.eventLogger.emit('add_stake', {amountAdded: amountAdded});
ctx.meter.Counter('stake_pool').add(amountAdded, { validator: VALIDATOR_POOL_ADDRESS });
}
}
)
```
**Data Outputs: From Raw Data to Actionable Insights**
Once your processor collects and transforms the data, Sentio provides several output formats to put it to work:
**Metrics**: Perfect for tracking numbers like trading volume, user count, or TVL. These power Sentio's built-in dashboards and alerting system.
**Event Logs**: Capture detailed activity records for user behavior analysis and debugging. Each event can include custom properties for rich analytics.
**Entities**: Store info on how different things are connected, like user profiles, token information, or protocol state. Ideal when you need to query relationships between different data points.
In the code example above, you can see both metrics (ctx.meter.Counter) and event logs (ctx.eventLogger.emit) in action. This processed data is something you can instantly access through Sentio's GraphQL API, SQL interface, and visualization tools.

**3. Transaction Debugging and Optimization**
On-chain debugging is notoriously tricky. Unlike basic block explorers that only show the final outcome, the Sentio Transaction Debugger gives you a complete replay of the transaction's lifecycle with detailed execution traces.

Here's what makes it so helpful:
**Complete Call Trace**: See the full call stack including cross-module function calls. Track inputs and outputs for each function call to pinpoint exactly where issues occur.

**Gas Usage Analysis**: The debugger shows resource consumption patterns and state changes, helping you identify performance bottlenecks. For example, if you notice a function consuming excessive resources, you can dive into its execution trace to see which specific operations are expensive, then optimize your Move code accordingly.

This turns debugging from a guessing game into a clear, step-by-step process. Instead of wondering why a transaction failed, you can see the exact function call that reverted and understand why.
**4. Archive RPC Nodes On-Demand**
Sometimes you just need direct blockchain access with full historical data. Public RPC endpoints typically only store recent data, and running your own archive node is complex and expensive.
Sentio provides dedicated RPC endpoints for Aptos Mainnet and Testnet with complete historical data access. Create them in minutes, not days.
Each node includes built-in monitoring:
- Request volume and error rate tracking
- Performance metrics and response time analysis
- Cost monitoring with transparent pay-per-request billing
**5. Ready-to-Use Blockchain Data with Data Studio**
While building custom processors is powerful for application-specific monitoring, sometimes you need immediate access to fundamental blockchain data without any setup. Sentio's **Data Studio** provides exactly that—a comprehensive collection of curated datasets covering essential blockchain information across multiple networks, including **Aptos**.
The Data Studio gives you instant access to core blockchain primitives through a familiar SQL interface. No need to set up indexers or write processors when you want to analyze basic on-chain activity patterns, investigate specific transactions, or perform network-wide research.
For Aptos Mainnet, you'll find clean, queryable tables for all the fundamental blockchain components:
- **Blocks**: Complete block data with timestamps, proposer information, and metadata
- **Transactions**: Full transaction details including gas usage, success/failure status, and execution info
- **Events**: All on-chain events emitted by smart contracts and system operations
- **Changes**: Resource and module state changes across accounts
- **Modules**: Smart contract deployment and update information
- **Resources**: Current and historical account resource states
Each dataset is continuously updated and optimized for analytical queries, so you can focus on extracting insights rather than managing data pipelines.
Here's a practical example that analyzes daily transaction patterns on Aptos:
```sql
SELECT
DATE(timestamp) as date,
COUNT(*) as total_transactions,
COUNT(CASE WHEN success = true THEN 1 END) as successful_transactions,
AVG(gas_used) as avg_gas_used,
SUM(gas_used) as total_gas_consumed
FROM aptos.transactions
WHERE timestamp >= NOW() - INTERVAL 30 DAY
GROUP BY DATE(timestamp)
ORDER BY date DESC
LIMIT 100;
```
This query gives you a 30-day overview of network activity, including transaction success rates and gas consumption trends—perfect for understanding network health and usage patterns.
The Data Studio interface makes it easy to iterate on queries, export results, and even save common analyses for your team. Whether you're conducting research, building reports, or need quick answers about on-chain activity, the curated datasets provide a solid foundation for blockchain data analysis.

## **Learn by Example: Tutorial Video**
We've created a comprehensive tutorial that walks through building your first Aptos monitoring project on Sentio from setup to deployment.
[**Sentio 102: Setup Realtime Monitoring For Your dApps on Aptos(New)**](https://www.youtube.com/watch?v=iPdJ1EYbh64)
## **Get Started**
Ready to build? Here's how to begin:
- [Start building](https://www.sentio.xyz/docs/quickstart) - Create your free account and deploy your first processor
- [Read the docs](https://www.sentio.xyz/docs/readme) - Detailed guides and examples
- [Join our Community](https://www.sentio.xyz/docs/community)- Connect with our team and other developers
The Aptos ecosystem is evolving rapidly. With the right infrastructure foundation, you can focus on building great products instead of solving infrastructure problems.
---
# Launch of Sentio Dash and Debugger on Sui
Source: https://www.sentio.xyz/blog/launch-of-sentio-dash-and-debugger-on-sui/
Published: 2024-04-12
Description: Sentio launches Dash and Debugger for Sui, enabling analytics, dashboards, and contract debugging.

Sentio launches [Dash](https://dash.sentio.xyz/) and [Debugger](https://app.sentio.xyz/explorer) products on Sui. Sentio has been a strong infrastructure provider that offers indexer, data analytics and monitoring capabilities for Sui ecosystems. One of our recent work is an open source project called [TypeMove](https://github.com/sentioxyz/typemove/blob/main/packages/sui/Readme.md), which helps to generate type bindings for Move contracts and allows developers to ship safer and faster.
With support from the [Sui Foundation](https://twitter.com/SuiNetwork) and [Mysten Labs](https://twitter.com/Mysten_Labs), Sentio now launches two new products that further elevates developer and user experience on Sui.
Sentio Dash
===========
Dash is a serverless, permissionless data platform that offers a flexible data schema, best-in-class dashboards, and fast query speed for custom projects. Dash enables users to explore Sui data with a click-and-drag experience; it also allows teams to access, collaborate, and utilize the data at an enterprise scale.
With Dash, you can start explore the Sui data following the steps below.
Explore dashboards
------------------
Once a user opens the [Dash](https://dash.sentio.xyz/) website, you can view all the public dashboards set up by other users. Search, filter and bookmark dashboards to navigate inside Dash!

If you want to know more about a dashboard, you can click into it to see the real-time updates and drill down to view other details in each chart.

Create a dashboard
------------------
For users who want to spin up your own dashboard. You can create a dashboard from the navigation bar placed at the top. Once a dashboard is created, you can add a panel located in the top-right corner.
Dash provides a click-and-drag experience for users to create charts without writing codes, which helps to democratize the data to everyone in the team. This unlocks teams to use data to improve products, marketing, and many other areas without spending much effort.
One example is that you can get the daily active users of swap events across all Dexes using functions provided in Dash and save it as a chart in your project.

For teams needing complex custom queries, Dash provides SQL widgets where you can get results in table or other chart types. Note that Dash adopts [ClickHouse](https://clickhouse.com/) SQL, which is known for its performance in executing complex analytical queries on massive datasets.

Dash supports time series database as well, this provides a blazing fast experience when you want to query time-based queries, e.g. show ing cumulative values or monitor some incidents.

Create a query
--------------
For users who just want to create an ad hoc query, you can simply click SQL Editor in the navigation bar, and write queries with existing datasets. You can add a query to a dashboard at a later time.

Export as API
-------------
For all charts created in Dash, you can export it as an API. This provides a serveless approach for users who do not want to maintain the database and backend, and yet they can still preview the results and use all different functions provided in Dash. Dash API currently supports 100 QPS (query per second).

Custom data source
------------------
Dash encourages the community to create more public datasets, so that other users could benefit from it. If you would like to contribute, feel free to reach out to the [Sentio](https://t.me/sentioxyz) team.
Sentio Debugger
===============
Sentio Debugger is the first advanced debugger on the Sui ecosystem that helps developers inspect and iterate smart contracts with an intuitive experience. It provides all the details of a transaction with unparalleled clarity. Sentio Debugger could help both beginners who are interested in learning more about the contract execution details and advanced engineers to identify issues with a strong productivity boost.
Sentio’s new product launch on Sui provides users with a new data and dev tooling stack to explore and build in the Sui ecosystem.
Simply going to the [Sentio debugger page](https://app.sentio.xyz/explorer), entering the transaction digest, users can view the detailed transaction information and traces of that transaction.


Dashboard Challenge
===================
To celebrate the launch of Dash on Sui, Sentio has sponsored prizes for the creation of useful dashboards on Dash.
Prize 1: Single Dex Analysis
----------------------------
Create a dashboard for one of the Dex project on Dash. You could choose any single Dex you are interested at. You can refer to the [Dex Analysis](https://dash.sentio.xyz/dashboard/ye/dex) to understand how charts are created based on Dex dataset. You are strongly encouraged to add more analysis perspectives in your dashboard. Make this dashboard useful, comprehensive, and visually appealing.
The top five submissions will get 50 SUI each, for a total of 250 SUI distributed.
Prize 2: Vertical Analysis
--------------------------
Create a dashboard for either Sui Lending or Sui Staking on Sentio’s [Dash](https://dash.sentio.xyz/discover) that covers at least the top three projects in the vertical. Make this dashboard useful, comprehensive, and visually appealing. Note you would need to upload your own processor to collect data in this task.
The top three submissions in each vertical will receive prizes: 300 SUI to the top dashboard, 200 SUI to the second-place dashboard, and 100 SUI to the third-place dashboard, for a total of 1200 SUI distributed.
The winners will be announced in [Sentio’s Twitter/X account](https://twitter.com/sentioxyz).
Deadline: April 20, 2024 at 8:00am UTC.
Submission: Submit your dashboard link to @is_ye on Telegram
Criteria: Sentio team will judge your dashboard on the basis of its completeness and depth
Support: if you have any questions on the challenge, you can reach out to [@is_ye](https://t.me/is_ye) on Telegram.
---
# Best Practice to track EigenLayer points
Source: https://www.sentio.xyz/blog/best-practice-to-track-eigenlayer-points/
Published: 2024-03-01
Description: Sentio enables efficient, real-time tracking and allocation of EigenLayer points for protocols like Renzo and Pendle.
> Author: [Ye](https://twitter.com/0x_ye), [0xbe1](https://twitter.com/_0xbe1), [ngfam](https://github.com/ngfam). Reviewer: [Anton](https://twitter.com/ayobuenavista), [pooleparty](https://twitter.com/JamesCPoole). Special thanks to ngfam and 0xbe1 for contributing the idea and code.

Background: the rise of EigenLayer ecosystem and EigenLayer points
==================================================================
DeFi users have flocked to [restaking protocol EigenLayer](https://www.dlnews.com/articles/defi/defi-trader-sifu-rides-eigenlayer-airdrop-for-pendle-yield/) (EL) and liquid restaking protocols (LRTs) recently due to a rising trend around [points](https://www.dlnews.com/articles/defi/why-defi-protocols-love-to-offer-points-before-airdrops/).
EigenLayer enables users to restake Ether to secure Ethereum and other protocols. For doing this, restakers can expect to receive additional yields from other protocols, in addition to the Ether staking yield they already receive.
EigenLayer stakers receive restaked points as a measure of their contribution to the EigenLayer ecosystem. The points are measured by the time-integrated amount staked in units of ETH ⋅ hours. For instance, a user who stakes 1 stETH for 10 days should accrue 240 restaking points over this time period (1 ETH × 10 days × 24 hours/day = 240 ETH ⋅ hours). Points are expected to be converted to tokens sometime in the second quarter.
Challenge: tracking EL points for EL ecosystem projects is hard
===============================================================
When users stake Ether through a liquid restaking protocol, the liquid restaking protocol is responsible for calculating the exact points allocation to all users and giving the corresponding points back to the users.
**Calculating this is HARD for protocols with a continuous point distribution stream.**

Taking liquid restaking protocol [Renzo](https://www.renzoprotocol.com/) as an example, the calculation looks simple if all users just hold ezETH. We just need to track all addresses holding ezETH and calculate the points accordingly. **However**, **this is not how it actually works in Defi**. There’s ezETH/ETH AMM pool for users to swap, where LPs provide liquidity for the AMM pools. If a user swap ezETH to ETH in the pool, the ezETH holding of all LPs in this AMM will get affected. Some might think, we could **take a snapshot** **periodically for the calculation**. Indeed, it simplifies the calculation; however, we think this is a big compromise as attribution fairness directly impacts the interest of users.
The point tracking becomes more complex when we consider Renzo needs to integrate ecosystem projects including Balancer, Curve, and [Pendle](https://www.pendle.finance/). It is not easy for Renzo to understand all details of the Pendle AMM, and for both teams to align and sync point calculations using a standard approach.
Tracking this with Subgraph is very hard; on the other hand, [Sentio](https://www.sentio.xyz) provides an easier and more programmable way for developers to control what data gets collected.
Solution: an efficient and standardised way to track continuous EL point stream
===============================================================================
Renzo, Pendle and Sentio has worked together to came up with an efficient and standardised approach, to help projects in EL ecosystem to track and allocate points.
1. Triggered by relevant events, we shall do something to update everyone’s points
```
CurveStableSwapNGProcessor.bind({
address: ezETH_WETH_LPT_ADDRESS,
startBlock: POOL_START_BLOCK,
})
.onEventAddLiquidity(async (event, ctx) => {
//do something to update everyone's the points
})
.onEventRemoveLiquidity(async (event, ctx) => {
//do something to update everyone's the points
})
.onEventTokenExchange(async (event, ctx) => {
//do something to update everyone's the points
})
.onEventTransfer(async (event, ctx) => {
//do something to update everyone's the points
})
```
2\. Inside each EventHandler, find relevant user(s), and update his(their) point(s).
> Case 1: For AddLiquidityEvent, only one user needs to get updated.
```
.onEventAddLiquidity(async (event, ctx) => {
//get user address, null if not found
const accountAddress = event.args.provider
//find current account snapshot
const accountSnapshot: AccountSnapshot | null = await db.asyncFindOne({
_id: accountAddress,
})
//update this user's point
await processAccount(ctx, accountAddress, accountSnapshot)
})
```
where you have type AccountSnapshot that’s persisted in nedb.
```
// Persisted in nedb
// Have to store (lptBalance, lptSupply, poolEzETHBalance, poolWETHBalance) as string rather than bigint for nedb serde
type AccountSnapshot = {
_id: string;
epochMilli: number;
lptBalance: string;
lptSupply: string;
poolEzETHBalance: string;
poolWETHBalance: string;
}
```
Yes. Sentio allows persisted local storage that you can read and write customised data into database. You can start using it in processoer by 1 line of code.
```
// files stored under /data will be persisted by sentio and accessible by processor
const db = new AsyncNedb({ filename: "/data/accounts.db", autoload: true });
```
> Case 2: After a swap event, more than one, in fact all LP users’ positions need to get updated.
```
.onEventTokenExchange(async (event, ctx) => {
//get all users
const accountSnapshots = await db.asyncFind({});
//update all users
for (const accountSnapshot of accountSnapshots) {
await processAccount(ctx, accountSnapshot._id, accountSnapshot);
}
})
```
3\. Calculate and update points
> Case 1: ezETH pool in Curve
Now we get to the implementation to calculate points and refresh them for users.
```
// accountSnapshot is null if snapshot hasn't been taken for this account yet
async function processAccount(
ctx: CurveStableSwapNGContext,
accountAddress: string,
accountSnapshot: AccountSnapshot | null
) {
//calcualte latest points in past period, and record
const elPoints = accountSnapshot
? calcPoints(ctx.timestamp.getTime(), accountSnapshot)
: new BigDecimal(0)
elPointCounter.add(ctx, elPoints, { account: accountAddress })
//use view function to get latest user info and record
const latestAccount = await getLatestAccountSnapshot(ctx, accountAddress)
await db.asyncUpdate({ _id: accountAddress }, latestAccount, {
upsert: true,
});
ctx.eventLogger.emit("point_update", {
lastUpdate: accountSnapshot?.epochMilli ?? 0,
elPoints,
...latestAccount
})
}
function calcPoints(
nowMilli: number,
accountSnapshot: AccountSnapshot
): BigDecimal {
// time check for async handler issue
if (nowMilli <= accountSnapshot.epochMilli) {
console.error(
"unexpected account snapshot from the future",
accountSnapshot
)
return new BigDecimal(0)
}
//update points using pool share
const deltaHour =
(nowMilli - accountSnapshot.epochMilli) / MILLISECOND_PER_HOUR
const { lptBalance, lptSupply, poolEzETHBalance, poolWETHBalance } =
accountSnapshot
const poolShare = BigInt(lptBalance)
.asBigDecimal()
.div(BigInt(lptSupply).asBigDecimal())
const accountEzETHBalance = poolShare.multipliedBy(
BigInt(poolEzETHBalance).scaleDown(TOKEN_DECIMALS)
)
const elPoints = accountEzETHBalance.multipliedBy(deltaHour);
return elPoints
}
```
> Case 2: ezETH pool in Pendle
The Pendle team has also provided standard functions to handle the tracking of EL points as outlined below. This boosts your integration efficiency by an order of magnitude.
```
ERC20Processor.bind({
address: PENDLE_POOL_ADDRESSES.SY,
startBlock: PENDLE_POOL_ADDRESSES.START_BLOCK,
name: "Pendle Pool SY",
}).onEventTransfer(async(evt, ctx) => {
await handleSYTransfer(evt, ctx);
})
PendleYieldTokenProcessor.bind({
address: PENDLE_POOL_ADDRESSES.YT,
startBlock: PENDLE_POOL_ADDRESSES.START_BLOCK,
name: "Pendle Pool YT",
}).onEventTransfer(async(evt, ctx) => {
await handleYTTransfer(evt, ctx);
}).onEventRedeemInterest(async(evt, ctx) => {
await handleYTRedeemInterest(evt, ctx);
}).onEventNewInterestIndex(async(_, ctx) => {
const YTIndex = await ctx.contract.pyIndexStored();
const YTIndexPreviousBlock = await ctx.contract.pyIndexStored({blockTag: ctx.blockNumber - 1});
if (YTIndex == YTIndexPreviousBlock) return;
await processAllYTAccounts(ctx);
});
PendleMarketProcessor.bind({
address: PENDLE_POOL_ADDRESSES.LP,
startBlock: PENDLE_POOL_ADDRESSES.START_BLOCK,
name: "Pendle Pool LP",
}).onEventTransfer(async(evt, ctx) => {
await handleLPTransfer(evt, ctx);
}).onEventRedeemRewards(async(evt, ctx) => {
await handleMarketRedeemReward(evt, ctx);
}).onEventSwap(async(evt, ctx) => {
await handleMarketSwap(evt, ctx);
});
EQBBaseRewardProcessor.bind({
address: PENDLE_POOL_ADDRESSES.EQB_STAKING,
startBlock: PENDLE_POOL_ADDRESSES.START_BLOCK,
name: "Equilibria Base Reward",
}).onEventStaked(async(evt, ctx) => {
await processAllLPAccounts(ctx, \[evt.args._user.toLowerCase()\]);
}).onEventWithdrawn(async(evt, ctx) => {
await processAllLPAccounts(ctx, \[evt.args._user.toLowerCase()\]);
})
ERC20Processor.bind({
address: PENDLE_POOL_ADDRESSES.PENPIE_RECEIPT_TOKEN,
startBlock: PENDLE_POOL_ADDRESSES.START_BLOCK,
name: "Pendle Pie Receipt Token",
}).onEventTransfer(async(evt, ctx) => {
await processAllLPAccounts(ctx, \[
evt.args.from.toLowerCase(),
evt.args.to.toLowerCase(),
\]);
});
ERC20Processor.bind({
address: PENDLE_POOL_ADDRESSES.STAKEDAO_RECEIPT_TOKEN,
startBlock: PENDLE_POOL_ADDRESSES.START_BLOCK,
name: "Stakedao Receipt Token",
}).onEventTransfer(async(evt, ctx) => {
await processAllLPAccounts(ctx, \[
evt.args.from.toLowerCase(),
evt.args.to.toLowerCase(),
\]);
});
```
4\. Reading data through API & charts
Sentio supports both time-series and relational DB. This makes it very easy to retrieve a user’s total points, which are ever-changing counter values through PromQL (instead of heavy computation at the query time), as well as complicated referral points attribution through SQL.
5\. Other implementation stuff
As we need to account the cumulative values of a user’s point here. Remember to set sequential mode to true.
```
import { GLOBAL_CONFIG } from "@sentio/runtime";
GLOBAL_CONFIG.execution = {
sequential: true,
}
```
Next step: help more EL ecosystem projects to track their point streams with ease!
==================================================================================
We believe this provides a straightforward method for tracking points across all EL ecosystem projects. By tracking the point streams, it ensures the interests of all users, thereby supporting the ongoing prosperity of the EL community.
Thanks to Pendle and Renzo. We have open-sourced all the core code for integration. If you are interested, talk to us!
We will extend this to other ecosystems that utilizes point system. Stay tune!
(P.S. we also expect an upgrade to nedb next week!)
A Little About Renzo
====================
Renzo is a Liquid Restaking Token (LRT) and Strategy Manager for EigenLayer. It provides an interface to the EigenLayer ecosystem, securing Actively Validated Services (AVS) and offering a higher yield than ETH staking. The Renzo protocol abstracts all complexity from the end-user and enables easy collaboration between users and EigenLayer node operators.
Learn more: [https://www.renzoprotocol.com](https://www.renzoprotocol.com)
A Little About Pendle
=====================
Pendle is the largest yield swaps protocol for term rates and yield trading in DeFi. Pendle’s adoption as a DeFi primitive has been growing across protocols and institutions, allowing access to deterministic yields and to hedge and speculate on yields.
Learn more: [https://pendle.finance/](https://pendle.finance/)
A Little About Sentio
=====================
Sentio is an observability platform for Web3. Sentio generates metrics, logs, and traces from smart contracts data through our low code solution, which could be used for anaytics & monitoring, simulate/debug transactions, data export API and more. Sentio supports Ethereum, BSC, Polygon, Solana, Sui, Aptos and more chains. Sentio is built by veteran engineers from Google, Linkedin, Microsoft, and TikTok, and backed by top investors like Lightspeed Venture Partners, Hashkey Capital, and Canonical Crypto.
Visit Sentio at [sentio.xyz](http://sentio.xyz/). Follow us on [Twitter](https://twitter.com/sentioxyz) for more updates.
---
# Partnership with Pyth
Source: https://www.sentio.xyz/blog/partnership-with-pyth/
Published: 2024-02-08
Description: Sentio partners with Pyth to enhance on-chain data analytics and support new use cases for crypto observability.
At Sentio, we are committed to provide fast, reliable data experience to users. We work together with Pyth to use data to drive growth.
We are proud to receive $PYTH tokens from their Restrospective Airdrop program. #PoweredByPyth
Pyth([https://pyth.network](https://pyth.network)).

**Introduction**
================
* Sentio is a developer-first tool that makes observability in crypto easier. Our product suite covers indexer, analytics, single-stepping debugger/simulator and code search.
* We have been partnering with Pyth to capture on chain data and help with growth analytics.
* We will continue to improve the data reliability further and improve the support for multiple chains.
**Future Plans or Collaborations**
==================================
* We will be exploring more frontier use cases in collaboration with Pyth, where data infra could bring further benefits to end users.
About Pyth
==========
* Website: [https://pyth.network](https://pyth.network)
* Price Feeds: [https://pyth.network/price-feeds](https://pyth.network/price-feeds)
* Docs: [https://docs.pyth.network](https://docs.pyth.network)
* Twitter: [https://x.com/PythNetwork](https://x.com/PythNetwork)
* Discord: [https://discord.com/invite/PythNetwork](https://discord.com/invite/PythNetwork)
A Little About Sentio
=====================
Sentio is an observability platform for crypto apps. Sentio generates metrics, logs, and traces from smart contracts data through our low code solution, which could be used for anaytics & monitoring, simulate/debug transactions, data export API and more. Sentio is built by veteran engineers from Google, Linkedin, Microsoft, and TikTok, and backed by top investors like Lightspeed Venture Partners, Hashkey Capital, and Canonical Crypto.
Visit Sentio at [sentio.xyz](http://sentio.xyz/). Follow us on [Twitter](https://twitter.com/sentioxyz) for more updates.
---
# Dive into MEV Through Data and Transaction Insights - series 1
Source: https://www.sentio.xyz/blog/dive-into-mev-through-data-and-transaction-insights-series-1/
Published: 2023-08-20
Description: Explains MEV strategies in DeFi using real transaction data and Sentio tools for analysis and insights.
Authors: [Ye](https://twitter.com/0x_ye) & [Kan](https://twitter.com/qiaokan) at [Sentio](https://twitter.com/sentioxyz)

### Introduction
In the ever-evolving landscape of blockchain and DeFi, Maximal extractable value (MEV) has emerged as a captivating and contentious subject. This blog article aims to demystify the concept of MEV and delve into the most interesting topics surrounding it with real transactions, data points and simple execution examples from **Sentio** ([website](https://www.sentio.xyz)).
### What is MEV and How big is it?
MEV refers to the potential profits that miners, validators, or transaction orderers can extract from the act of sequencing transactions in a block before adding them to the blockchain. This ability to reorganize the transaction order opens the door to various profit-seeking opportunities.
To provide an idea of how big the MEV opportunities are, the visual below plots the daily revenue and profit generated from two types of MEV strategies (i.e. arbitrage and sandwich) in recent 14 days. The daily revenue combined averages more than USD$500k per day, and the daily profit averages around $100k. The well-know jaredfromsubway.eth alone, in the left side of the visual, took half of all sandwich profit and revenue.

You can refer to up-to-date and more detailed stats here at [https://app.sentio.xyz/qiaokan/eth-mev-analytics/dashboards/e50idSGx](https://app.sentio.xyz/qiaokan/eth-mev-analytics/dashboards/e50idSGx) (:rotating_light:: Sentio team puts limited effort maintaining this dashboard. It might contain mistakes, welcome to contact us to right the wrongs!)
### How Does MEV Work?
#### 1. Arbitrage
Let's start from a "simple" strategy called arbitrage to illustrate how an MEV transaction works. Let's take a high-level look at the workflow of a typical MEV arbitrage transaction as the image below shows.

An arbitrage transaction (1) starts from an MEV-bot (a.k.a searchers) discovers that there's price gap between 2 liquidity pools. (2) Then the bot can buy from the low-price pool and sell at the high-price pool within a single transaction, to generate profit.
For example, transaction `0xa62d6125bead1ce19f37715ad16ef0560a48aa0bb9e884a8a9f9101d885271b5` is an arbitrage transaction. You can see the detailed Fund Flow, Blance Changes and Call Trace to understand the execution of this transaction step by step, with the help of Sentio Debugger at [https://app.sentio.xyz/qiaokan/eth-mev-analytics/transaction/1/0xa62d6125bead1ce19f37715ad16ef0560a48aa0bb9e884a8a9f9101d885271b5](https://app.sentio.xyz/qiaokan/eth-mev-analytics/transaction/1/0xa62d6125bead1ce19f37715ad16ef0560a48aa0bb9e884a8a9f9101d885271b5 "app.sentio.xyz").

The MEV-bot `0x1a6...` in the middle of the figure is the one who initiated this transaction. In this transaction, the MEV-bot was able to detect that the price of `SDEX` to `WETH` was cheaper in Uniswap V3 `SDEX-WETH` pool `0xc7c...` than the SmarDex `SDEX-WETH` pool `0xf3a...` (SmarDex is a Uniswap V2 alike DEX). The MEV-bot swapped `5.91 WETH` for `1.05M SDEX` in the low-price pool first, then swapped the received `1.05M SDEX` to `5.98 WETH` in the high-price pool. The MEV-bot ended up with `0.07 ETH` revenue.
You might have noticed that #5 step in this transaction pays `0.047 ETH` to the `Flashbots: Builder`, this is the bribe MEV-bot pays the block builder to get included in the coming block. Taking consideration of the bribe fee, the MEV-bot made `0.02 WETH` profit where he kept to himself.
Diving a little deeper, let's also understand how MEV-bot `0x1a6...` found this opportunity. We can see this MEV transaction `0xa62d...` sits at `position 1` of `block 17935927` ([https://etherscan.io/txs?block=17935927](https://etherscan.io/txs?block=17935927)). Right before this transaction, there is a transaction `0x8fa..` at `position 0` of the same block. This transaction at [https://app.sentio.xyz/qiaokan/eth-mev-analytics/transaction/1/0x77f8e42e7d3686f2dc95fa8a2dfbb254b96ca324b4c18acc9c917ad3c74cceb2](https://app.sentio.xyz/qiaokan/eth-mev-analytics/transaction/1/0x77f8e42e7d3686f2dc95fa8a2dfbb254b96ca324b4c18acc9c917ad3c74cceb2) swapped a large volume swap from `8.52 ETH` to `1.5M SDEX` in the SmarDex pool (`0xf3a...`). This transaction moved the price of `SDEX` to `WETH` higher in this pool.

MEV-bot above was able to notice this and added a transaction of his own right after this transaction to capture this 'buy low, sell high' opportunity.
How did the MEV-bot 'see' a transaction before it was included in a block? Here comes the **mempool**: before transactions are added to a block and added to the blockchain, they exist in a pool called the mempool. Transactions in the mempool are not yet confirmed and are waiting for inclusion in the next block. Block builders are responsible for selecting which transactions to include and in what order. This process can be influenced by factors such as transaction fees and gas prices (Remember the bribe fee we discussed in the last section? That's the fee MEV-bot pays to get included).
In the above context, the MEV-bot at `position 1` was able to view all mempool transactions and it discovered the `0x8fa...` transaction was an opportunity. Next, the MEV-bot added another transaction right behind it to form a bundle to capture the profits. MEV-bot can create bundle by using tools like [Flashbot](https://docs.flashbots.net/flashbots-auction/searchers/advanced/understanding-bundles) and force the bundle transactions get included in same block and executed in the wanted order.
In fact, there are more MEV transactions happened in this particular block. As this is a flashbot built block, you can click into this [Flashbot explorer built by Marto](https://flashbots-explorer.marto.lol/?block=17935927) to see more tranctions and see the Fund Flow, Balance Changes, and Call Trace details in Sentio Debugger.
#### 2. Sandwich
While arbitrage typically appends a transaction after a profitable transaction, sandwich is a strategy that profits from adding 1 (or more) transaction(s) before and after a victim transaction and force these transactions to get executed sequentially. Let's take a high-level look at the workflow of a typical MEV sandwich transaction as the image below.

Firstly, an user submits a transaction to mempool. An MEV bot that constantly monitors all mempool transactions, is able to capture this transaction, and determines if this transaction could be a profitable opportunity for sandwich. Once the opportunity is identified, the MEV bot needs to create a bundle by inserting transactions before and after this victim transaction (like wrapping a sandwich), and propose the bundle to the block builder. When the mempool transactions get included and executed in the next block, bundled transactions will get executed in the exact sequence per below (visual by [Jeiwan](https://github.com/Jeiwan/uniswapv3-book) in [Uniswap V3 development book](https://uniswapv3book.com/)).
The MEV-bot generates profit by manipulating the pool liquidity. At the front-running transaction, so that the MEV-bot can buy asset at a lower price. After the victim position, the attacker sell previously bought tokens at a higher price.
Let's use below 3 recent transactions at position 0-2 of block `17786884` as the example.
##### Position 0 (front-running): transaction `0x850...`
[https://app.sentio.xyz/qiaokan/eth-mev-analytics/transaction/1/0x85066660888a0effb4bf8d513c51a9770f780bc753a3df68d47f372b0c22b2b7](https://app.sentio.xyz/qiaokan/eth-mev-analytics/transaction/1/0x85066660888a0effb4bf8d513c51a9770f780bc753a3df68d47f372b0c22b2b7)
This transaction was inserted by MEV-bot to swap `724.6 WETH` to `1.34M USDC` before the victim transaction, which was transacted at `1857 ETH/USDC` price.

##### Position 1 (the victim): transaction `0xc3ae...`
[https://app.sentio.xyz/qiaokan/eth-mev-analytics/transaction/1/0xc3aeb0d0fdb67f5d31e65af33092657ada44c2cd628e0a5c2c9bee0956d7134c](https://app.sentio.xyz/qiaokan/eth-mev-analytics/transaction/1/0xc3aeb0d0fdb67f5d31e65af33092657ada44c2cd628e0a5c2c9bee0956d7134c)
The victim user `0xc3a...` wanted swap `2743 ETH` to `USDT` in Uniswap V3, which was handled by the Uniswap Router and eventually transacted at an average `1851 ETH/USDC` price. Because of the front-running transaction, the victim suffered from a higher price. On the pool `0x88e...` that the MEV-bot had front-run in the previous position, `1782 ETH` was swapped to `USDT` at `1850.5 ETH/USDC` price.

##### Position 2 (back-running): transaction `0x040...`
[https://app.sentio.xyz/qiaokan/eth-mev-analytics/transaction/1/0x0403d7d443565763c3b119ed6e70aa5ac48f2cd1533e6188d03fdb79cc33a1a1](https://app.sentio.xyz/qiaokan/eth-mev-analytics/transaction/1/0x0403d7d443565763c3b119ed6e70aa5ac48f2cd1533e6188d03fdb79cc33a1a1)

This transaction was inserted by MEV-bot after the victim transaction. `134M USDC` was swapped to `727.6 ETH`.
Net result of position 0 and 2, is that MEV-bot gained `3 ETH`, and the victim suffered a higher swap price. Below visuals of balance changes in these two positions can provide a quick view of how much the MEV-bot received.


To protect swaps from sandwich, you shall always set a maximum slippage. Otherwise the slippage will be be utilised by the sandwich attack and becomes revenue for MEV-bot (e.g. set a percentage in the swap setting inside the app UI or amountOutMinimum/sqrtPriceLimitX96 parameters when you do it programmatically).
#### 3. Liquidation
Lending protocols are decentralised platforms that connect lenders and borrows (e.g. MakerDAO, Aave, Compound, etc). Borrowers can borrow a certain value of debts when collaterals are supplied in the platforms. Liquidation happens when a borrower's collateral can't cover their debt. Liquidators are incentived to buy collateral at a discount to cover the borrower's debt. (Read more about liquidation from [Aave's article](https://docs.aave.com/developers/guides/liquidations))

Let's use the following transaction as an example [https://app.sentio.xyz/qiaokan/eth-mev-analytics/transaction/1/0x652ebf2f56716ed0ce2412839cd1ed0c9cf44105ab9e688fb0a7572b82ebec9f](https://app.sentio.xyz/qiaokan/eth-mev-analytics/transaction/1/0x652ebf2f56716ed0ce2412839cd1ed0c9cf44105ab9e688fb0a7572b82ebec9f)

The MEV-bot `0x310...` started the liquidation by getting a `212 USDT` flashloan from Balancer. Then the MEV-bot paid off the USDT owed by borrower `0x994...` in step 3-8, and MEV-bot got the collateral `223 TUSD` at a discount in return. In step 8-11 the MEV-bot swapped all received `TUSD` to `WETH` and `USDT` and paid off the initial flashloan at step 12. All steps are completed in one single transaction.
#### 4. Long tail MEV
Arbitrages, sandwichs and liquidations represent the majority of MEV being extracted. There are other strategies being exploit in MEV out there which are niche, arcane and undiscovered ([reference](https://calblockchain.mirror.xyz/c56CHOu-Wow_50qPp2Wlg0rhUvdz1HLbGSUWlB_KX9o)). These are known as the long tail MEV.
### Contact Us
If you are MEV researcher/searcher/anyone who's interseted in MEV, let us know what you are most interested in, this will help us to decide the topic of in the upcoming serie 2.
If you think Sentio's product could be helpful for what you are working on, shoot us a message at hi@sentio.xyz and we'd love your suggestions/feedback to navigate future product roadmap.
### A Little About Sentio
Sentio is an observability platform for Web3. Sentio generates metrics, logs, and traces from smart contracts data through our low code solution, which could be used for anaytics & monitoring, simulate/debug transactions, data export API and more. Sentio supports Ethereum, BSC, Polygon, Solana, Sui, Aptos and more chains. Sentio is built by veteran engineers from Google, Linkedin, Microsoft, and TikTok, and backed by top investors like Lightspeed Venture Partners, Hashkey Capital, and Canonical Crypto.
Visit Sentio at [sentio.xyz](http://sentio.xyz "sentio.xyz"). Follow us on [Twitter](https://twitter.com/sentioxyz "Twitter") for more updates.
---
# Sentio Q2 Product Update
Source: https://www.sentio.xyz/blog/sentio-product-update-q2-2023/
Published: 2023-08-08
Description: Read our inaugural product update with loads of new features and enhancements.

GM!
Welcome to Sentio's inaugural product update. Join us as we delve into the thrilling advancements we've achieved in Sentio during Q2.
### 1. New Features
We're thrilled to unveil a lineup of major product announcements this quarter:
#### Sentio Debugger

Navigating and troubleshooting transactions in the crypto world can be challenging. Sentio's pioneering single-stepping debugger is designed to demystify the process. Gain full visibility into transaction metadata, contracts, events, states, balance changes, fund flow, call traces, and more. Presently available on the Ethereum mainnet. (Reach out if you're eager to see it on other chains!)
##### Transaction Explorer
Unearth the transaction details you seek effortlessly. Visit [https://app.sentio.xyz/explorer](https://app.sentio.xyz/explorer) or click the sidebar within [app.sentio.xyz](app.sentio.xyz). Simply input the transaction hash and unlock comprehensive information with a few clicks.
##### Single-stepping Debugger
When a function-level debugger falls short, our single-stepping debugger shines. Explore transaction `0xf86a40d6421b7b0f29a6baacd8d11e1d2444dd4974e4cf554a367c95fdb1d79c` from Blur as a case in point. Pinpoint the exact condition leading to a revert.
Set breakpoints, inspect variables and expressions with ease. Seamlessly handle these tasks within the debugger.
#### User Segmentation (Accounts)

You can segment users based on their on-chain behaviors! You can find numbers of users performed certain action and check who these users are by choosing easy-to-use filters and conditions. e.g. Find out who are the users that spend more than 10 dollar in both of cetus and turbos dapps on Sui. Dive into their activities pre and post-interaction for insightful marketing, content, and product enhancements.

#### SQL Editor

Your requests have been answered. Our SQL editor simplifies complex, custom queries. Export queries with a single click, generating data query APIs for frontend integration in seconds.
#### User Page - Plan Usage Details & Billing

For active Sentio users, detailed usage tracking is now accessible in the User Panel - Plan Details & Billing.

Newcomers can seamlessly subscribe to plans via self-service.

#### Alert
- Support Discord and PagerDuty
- Ability to mute an alert for a period of time
- Alert message now can be fully customized with templating

### 2. Community and User Spotlight
#### Chain support
In May, we embraced Sui's initial mainnet launch, embracing its vibrant community and feedback. Despite a mere two months since Sui's launch, many projects onboarded Sentio. The road ahead promises more excitement!
In the midst of Jul, we supported Conflux, Linea and Mantle right after their mainnet launch.

#### User spotlight
July saw our esteemed partner, Thala, a leading CDP and DEX on Aptos, spotlight Sentio in a data-driven [blog](https://thalalabs.medium.com/building-a-data-driven-thala-using-sentio-ddc850276af). Discover why Thala chose Sentio and how it fuels their business.

Stay tuned for more as Sentio continues its journey at the forefront of innovation. Your support keeps us inspired! 🚀
---
# Sentio and Astar Network Enhance Observability in the Community
Source: https://www.sentio.xyz/blog/sentio-and-astar-network-enhance-observability-in-the-community/
Published: 2023-03-13
Introduction
============
We’re thrilled to announce a new collaboration between Sentio, a leader in Web3 observability solutions, and Astar Network, a scalable decentralised blockchain for the next big Web3 innovations. This collaboration will enable better development and growth of the Dapps in the Astar Network ecosystem.

Collaboration Details
=====================
As part of this collaboration, Sentio will provide its industry-leading observability tools to the Astar Network, allowing a dev-friendly approach to monitoring, analyzing, and diagnose of the smart contracts in the platform, starting with EVM. This will enable the Astar Network community to better gain the visibility of their applications, and identify issues more quickly, with all the context needed in one platform.
Benefits for Community
======================
The ecosystem has long awaited a solution for easy-to-use data analytics and monitoring. By leveraging Sentio’s observability solutions, Astar Network Dapps can easily handle these. Use cases include ‘click-and-drag’ data analysis without writing complex queries, more flexibility to collect your own data, and live monitoring and alerts to secure assets. Read more about Sentio on [our docs](https://www.sentio.xyz/docs).
Observability is critical for ensuring the growth and development of decentralised applications. By working together with Sentio, Astar Network is demonstrating its commitment to providing best-in-class toolings for developers and users alike. This collaboration will help drive innovation and advancement within the industry, ultimately benefiting everyone involved.
A Little About Sentio
=====================
Sentio is an observability platform for Web3. We are pushing the limits of both time series and relational databases and using them together to give great experiences to our users. Sentio generates metrics, logs, and traces from existing smart contracts data through our low code solution, which could be used to build dashboards, set up alerts, analyze user behaviors, create API/Webhooks, simulate/debug transactions, and more. Sentio supports Ethereum, BSC, Polygon, Solana, and Aptos and more chains. Sentio is built by veteran engineers from Google, Linkedin, Microsoft, and TikTok, and backed by top investors like Lightspeed Venture Partners, Hashkey Capital, and Canonical Crypto.
Visit Sentio at [sentio.xyz](https://www.sentio.xyz). Follow us on [Twitter](https://twitter.com/sentioxyz) for more updates.
---
# Sentio raises 6.4M led by Lightspeed to bring modern observability to decentralized applications
Source: https://www.sentio.xyz/blog/sentio-raises-6-4m-led-by-lightspeed/
Published: 2023-02-21
Funding round enables Sentio to bring the first end-to-end observability platform to help people gain insights, secure assets, and troubleshoot transactions for their decentralized applications.

Seattle, WA, 2/21/2023
Sentio has raised $6.4 million to bring modern observability to decentralized applications. The funding round was led by Lightspeed Venture Partners with participation from industry leaders Hashkey Capital, Canonical Crypto, Essence VC and GSR Ventures. The Sentio team consists of veteran engineers from Google, Linkedin, Microsoft and TikTok, and is uniquely positioned to build in this space because of our extensive experience in both observability and crypto.
Smart contracts are the entire backend infrastructure for a DApp. They are more mission-critical than their Web2 counterparts as smart contracts often handle user assets directly and are more vulnerable to exploits due to openness and composability. While Web2 observability solutions such as Datadog and Elastic proliferate, Web3 observability solutions are lacking and fragmented. This results in DApp developers having to develop and host in-house solutions, taping together fragmented third-party tools or, in many cases, operating their DApps without adequate monitoring and visualization. Furthermore, according to Fortune Crypto, in 2022, cybercriminals hacked over $3 billion from crypto networks and protocols, which nearly doubled from $1.55 billion in 2021. In October 2022 alone, $718 million was stolen from decentralized finance protocols.
Sentio provides modern monitoring, alerting and log management for decentralized applications as an integrated and hosted experience. Users can use Sentio’s SDK to collect and transform metrics and logs generated based on their smart contracts’ events, transactions, traces and states. Sentio fully manages the indexing process, and users can visualize and set up alerts on the metrics and perform advanced search on the logs, all via Sentio’s web interface. Additional observability features such as User behavior analytics and transaction simulation/debugger are under development. Currently, Sentio supports Ethereum, Aptos, BSC, Polygon, Arbitrum, Optimism, Avalanche and Moonbeam.
“Sentio’s bespoke and flexible on-chain data collection engine makes it possible for us to build dashboards that we can’t build on other platforms.” said Blake West, co-founder and CTO of Goldfinch. “We can iterate fast and have been getting a lot of value from Sentio.”
“We are a data-driven team and we set high bars when it comes to observability solutions for our DEX.” said Alejo Pinto, Founder of Pontem Network. “We can gain insights into every pool on LiquidSwap on the most granular level and use Sentio’s API to spin up a stat page that our entire community can benefit from.”
Ravi Mhatre, founding partner at Lightspeed added, “As smart contract development continues to grow exponentially, developers are increasingly seeking more tools to augment their development and runtime workflows. Lightspeed has a long history of backing enterprise grade developer tools, and we are starting to see patterns emerge to support use cases that mirror these needs in Web3. We are very proud to be backing this technically talented team tackling observability and monitoring for Web3.”
Fuyao Zhao, co-founder and CEO, is excited about the product. “Sentio’s mission is to accelerate DApp proliferation by bringing the best and battle-tested developer tools, infrastructure and philosophy to the crypto world.”
To try out Sentio, go to [sentio.xyz](https://app.sentio.xyz) to sign up for an account. You can refer to sentio.xyz/docs about how to get started with the product.
---
# Golang Generics v.s. Interfaces: Best Practices
Source: https://www.sentio.xyz/blog/golang-generics-v-s-interfaces-best-practices/
Published: 2023-02-09
Author: [Kan Qiao](https://twitter.com/qiaokan)
Introduction
------------
Since `Go 1.18`, Go starts to support generics. However, this article is not what generics are (there are plenty of articles already), but when to use them? The obvious TLDR is: When you need to write the same logic for multiple types, use generics. This sounds easy to understand, but when we are facing the real cases, we have a another option: using `interfaces`. Then the question is: when to use generics over interfaces? We will discuss this using examples in this article.
Let’s Start With A Simple Example
---------------------------------
`sort.Sort` provides a way to sort a slice of `Interface`.
```
func Sort(data Interface)
```
And the `Interface` is defined as:
```
type Interface interface {
Len() int
Less(i, j int) bool
Swap(i, j int)
}
```
Thus, if an `array` has a `Len`, `Less` and `Swap` method, it can be sorted by `sort.Sort`.
In a lot of cases, `generics` can achieve the same goal. And in most of the cases, they have similar performance. However, `generics` has a real advantage: **You know the concrete type directly.** Why is this so useful?
Why Do We Need To Know The Concrete Types?
------------------------------------------
Let’s take a look at another example. Assume you need to write a storage controller that can read/write data from/to a given file. You only need the object to be able to `Marshal` and `Unmarshal` to/from `JSON`. You can write the code like this:
```
type Object interface {
...
}
```
```
type FileStorage struct {
fileName string
}
func (s *FileStorage) Load(ctx context.Context, ch chan<- Object) error {
...
}
func (s *FileStorage) Save(ctx context.Context, ch <-chan Object) error {
...
}
```
For `Save`, there is no problem. Since the `Object` is an `interface`, you can pass any object that implements the `Object` interface. The actual type is known at runtime of `Marshal`. However, for `Load`, the problem is that you don’t know the actual type of the object before you `Unmarshall` it. A verbose way to solve this is to use a auxiliary struct to wrap the object with type information when you `Marshall` and `Unmarshall` it. That is very annoying.
But let’s think about it, why do we need store this information? The answer is: **We don’t know the concrete type of the object because it is an interface.** Using `generics`, you can solve this problem in a much more elegant way:
```
type FileStorage\[OBJ any\] struct {
fileName string
}
```
```
func (s *FileStorage\[OBJ\]) Load(ctx context.Context, ch chan<- OBJ) error {
orig, err := os.ReadFile(s.fileName)
if err != nil {
return err
}
var data \[\]OBJ
if err = json.Unmarshal(orig, &data); err != nil {
return err
}
for _, obj := range data {
select {
case <-ctx.Done():
return ctx.Err()
case ch <- obj:
}
}
return nil
}
```
because the `OBJ` is a concrete type, you can use it directly in the `Load` function. You don’t need to use a wrapper struct to store the type information. The only issue you might have is that you need to instantiate the `FileStorage` with a concrete type. But this should be feasible in most cases as you only have a few types in your program.
Conclusion
----------
In this article, we discussed when to use `generics` over `interfaces`. A more concrete best practices is:
* For your controller objects, use `interfaces` to make them more flexible.
* For your data objects, use `generics` to make your code more concise and elegant.
A Little About Sentio
---------------------
[Sentio](https://twitter.com/sentioxyz) is an observability platform for Web3. Sentio generates metrics, logs, and traces from existing smart contracts data through our low code solution, which could be used to build dashboards, set up alerts, analyze user behaviors, create API/Webhooks, simulate/debug transactions and more. Sentio supports Ethereum, BSC, Polygon, Solana, and Aptos. Sentio is built by veteran engineers from Google, Linkedin, Microsoft and TikTok, and backed by top investors like Lightspeed Venture Partners, Hashkey Capital and Canonical Crypto.
Visit Sentio at [sentio.xyz](http://sentio.xyz). Follow us on [Twitter](https://twitter.com/sentioxyz) for more updates.
---
# Complete blockchain data testing suites: Ensure Data Reliability and Availability
Source: https://www.sentio.xyz/blog/complete-blockchain-data-testing-suites/
Published: 2023-01-31
Author: [Kan Qiao](https://twitter.com/qiaokan)
Why Test Storage Infrastructure? How Is It Different?
-----------------------------------------------------
Storage infrastructure testing is critical because it helps to ensure the reliability, availability, and security of our data storage systems. Robust and Correct storage infrastructure makes application developers’ lives easier. It allows them to focus on the application logic and not worry about the underlying storage infrastructure.
In this article, we will delve into the topic of storage infrastructure testing, with a specific focus on its application within the blockchain data systems. In the end, we add an appendix for a more comprehensive list of testing types.
Testing Storage Infrastructure for Blockchain Data Systems
----------------------------------------------------------
What Is Blockchain Storage System?
----------------------------------
A blockchain data storage system is responsible for storing and updating blockchain data in real-time. It then serves the data to clients, including Extract, Transform, Load (ETL) or analytics jobs. Many blockchain infrastructure companies, including [Sentio](https://twitter.com/sentioxyz), maintain such systems. In this explanation, we will use [Sentio](https://twitter.com/sentioxyz) as an example to provide more detailed information on the testing process.
We maintained a in-house system that stores all the blockchain data, in real-time, that exposes various APIs to different internal clients. There are multiple data pipelines, storage systems, services and many layers of abstractions. So the obvious question is how to ensure correctness of the system, given that it is too complicated for human mind.
Unit Tests, Integration Tests and More
--------------------------------------
We write and run a lot of unit tests. Beyond standard unit tests and integration tests, additional tests are employed to detect more complex issues. For example, we utilize the built-in golang race detector (thread sanitizer) to identify multi-threading issues. One real-world example of an issue that was discovered using this method is:
```
WARNING: DATA RACE
Write at 0x00c009afb8e0 by goroutine 1119:
sentioxyz/sentio/driver/indexer.(*ChainIndexer).runProcessor.func1()
driver/indexer/chain_indexer.go:477 +0xfc
golang.org/x/sync/errgroup.(*Group).Go.func1()
external/org_golang_x_sync/errgroup/errgroup.go:75 +0x86
```
```
Previous write at 0x00c009afb8e0 by goroutine 1116:
sentioxyz/sentio/driver/indexer.(*ChainIndexer).runProcessor.func1()
driver/indexer/chain_indexer.go:477 +0xfc
golang.org/x/sync/errgroup.(*Group).Go.func1()
external/org_golang_x_sync/errgroup/errgroup.go:75 +0x86Goroutine 1119 (running) created at:
golang.org/x/sync/errgroup.(*Group).Go()
external/org_golang_x_sync/errgroup/errgroup.go:72 +0x12e
sentioxyz/sentio/driver/indexer.(*ChainIndexer).runProcessor()
driver/indexer/chain_indexer.go:475 +0x4d7
sentioxyz/sentio/driver/indexer.(*ChainIndexer).processHandlerResults.func1()
driver/indexer/chain_indexer.go:639 +0x364Goroutine 1116 (finished) created at:
golang.org/x/sync/errgroup.(*Group).Go()
external/org_golang_x_sync/errgroup/errgroup.go:72 +0x12e
sentioxyz/sentio/driver/indexer.(*ChainIndexer).runProcessor()
driver/indexer/chain_indexer.go:475 +0x4d7
sentioxyz/sentio/driver/indexer.(*ChainIndexer).processHandlerResults.func1()
driver/indexer/chain_indexer.go:639 +0x364
\==================
```
You may notice that there is a variable at line 477 that is being read/written by more than one thread at the same time without proper synchronization, creating a race condition.
Simulation/Performance Tests
----------------------------
[_Simulation test_](#d33f) (defined in appendix) for blockchain storage system is less complex than traditional systems as the data on blockchain is deterministic. Furthermore, if the program is deterministic as well, identical results will always be produced given the same input. If we take a snapshot of the current output (as golden), and compare it with a future output, we could spot discrepancies so that bugs can be identified.
We are also particularly interested in finding out whether the system behaves correctly under abnormal conditions (restarts, network issues, pod being evicted, node being shut down, etc.). To address this, we introduced a framework that runs tests, where failures of all dependencies are simulated, to ensure that the system is robust and able to handle adverse conditions without producing incorrect results.
All the test scenarios and configurations are described in a yaml file.
```
fault-injections:
- type: intermittent-error
target-services:
- xxxx
interval: 1m
probability: 0.02
error-code: 500
```
The test result contains aggregated historical results and compared with the golden snapshot. Here is a list of historical setups.
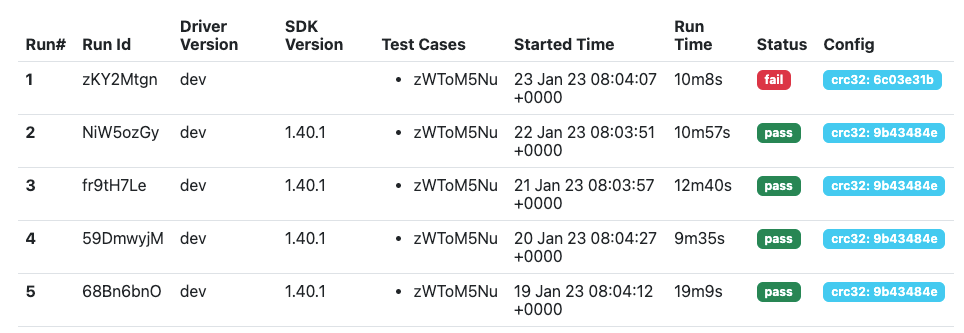
We also include performance tests into the same test, enables us to keep track of the historical performance histogram and to detect performance regressions.
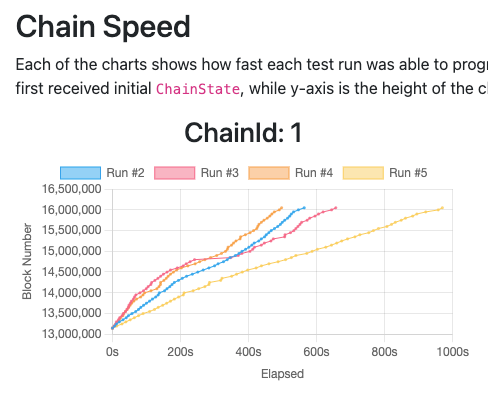
In order to capture the individual performance of each component that we depend on, we also have captured the performance histogram of outbound calls made to key APIs.
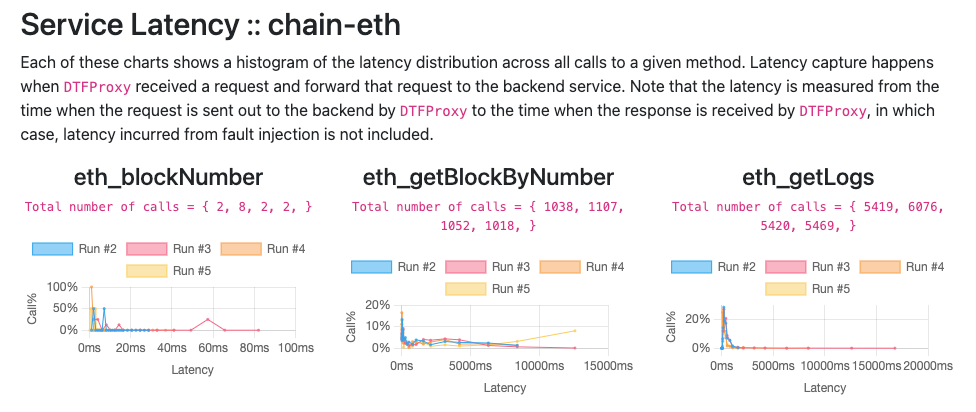
Testing For Blockchain Reorg
----------------------------
A blockchain reorg occurs when there are two competing chains of the same length. The longer chain becomes the canonical chain, and the shorter one becomes the orphan chain. However, clients may still be using the orphan chain as they may not be aware of the reorg until a new block from the canonical chain is received. To test for this scenario, we ensure **eventual consistency** by running a test that follows a node for a day or two. Another test is then run to catch up to the same state as the first test. If the blockchain is eventually consistent, the second test should be able to reach the same state as the first test.
Profiling
---------
Sometimes we found there are some hotspots in the code. We use the `pprof` tool to identify the root cause of the hotspot. Here is an example of the `pprof` output that indicates the hotspot is decoding:
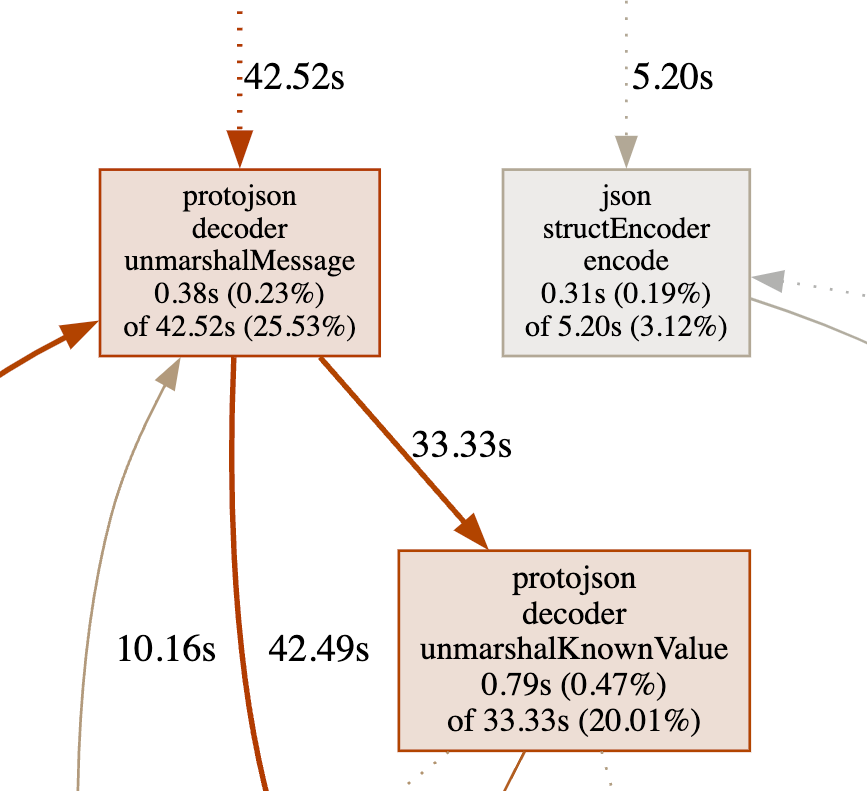
Compatibility Tests
-------------------
[Sentio](https://twitter.com/sentioxyz) has an SDK that allows users to integrate [Sentio](https://twitter.com/sentioxyz) into their own systems. We have a compatibility test to ensure the SDK is compatible with the latest version of Sentio. Thus, we maintain backward compatibility for our SDK. Here is an example of compatibility matrix.
From the figure, you could notice there is an compatibility issue between SDK v1.13 and runtime v1.11. We need to fix the issue before we can release the Runtime v1.11.
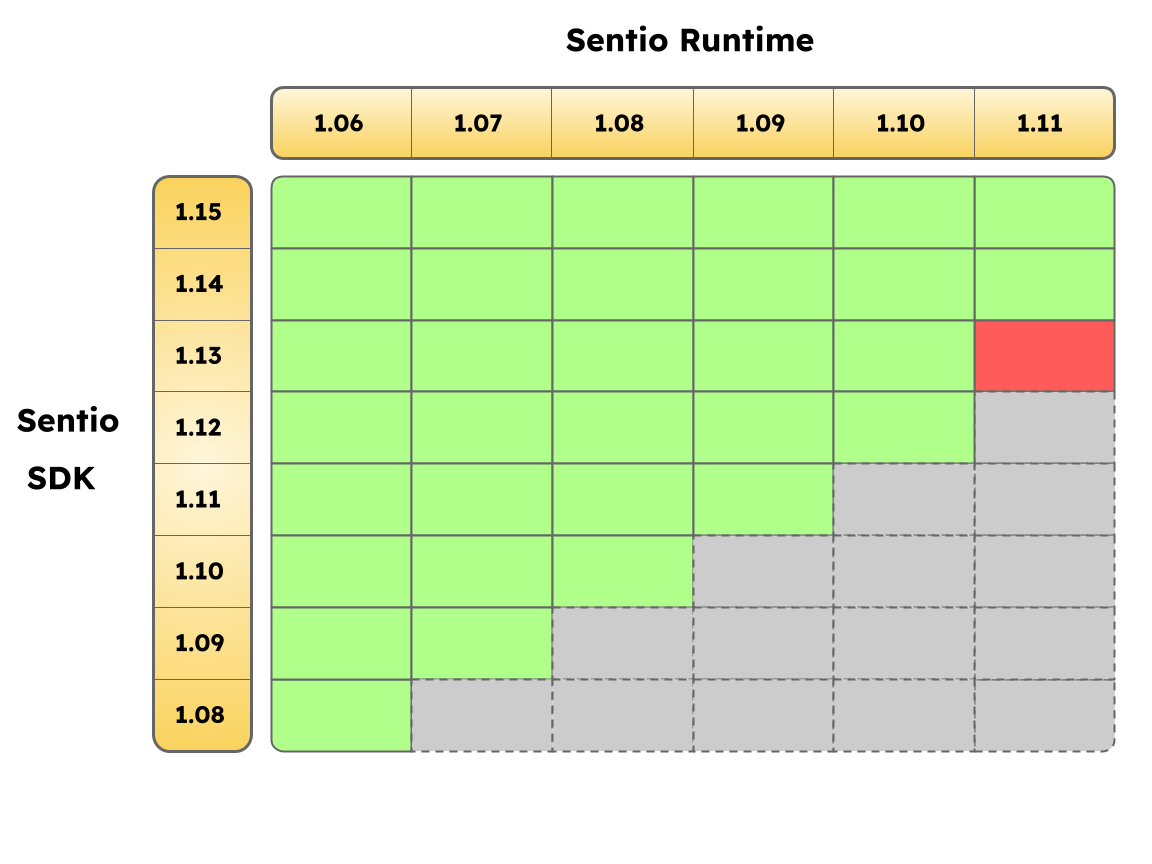
Production Monitoring
---------------------
We set up a number of metrics to monitor the system. We also set up a number of alerts to monitor the system. Here is an example of how we monitor our chain synchronization speed.
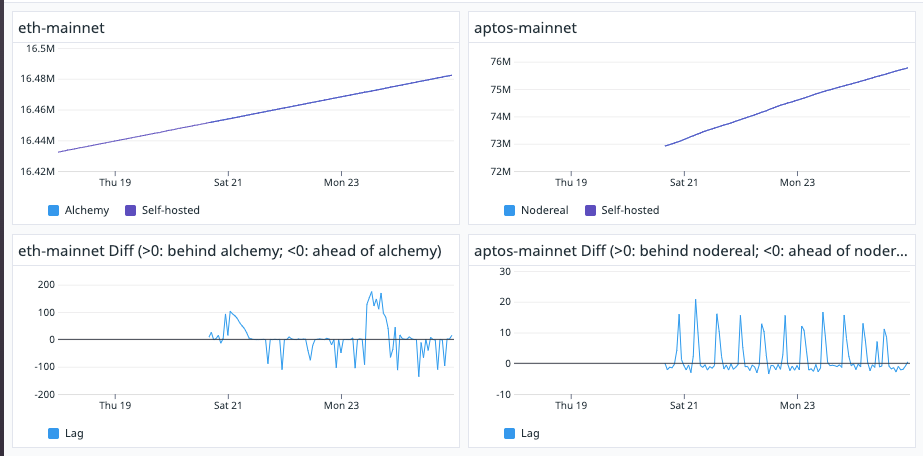
If the chain synchronization speed is too slow, we will get an alert.
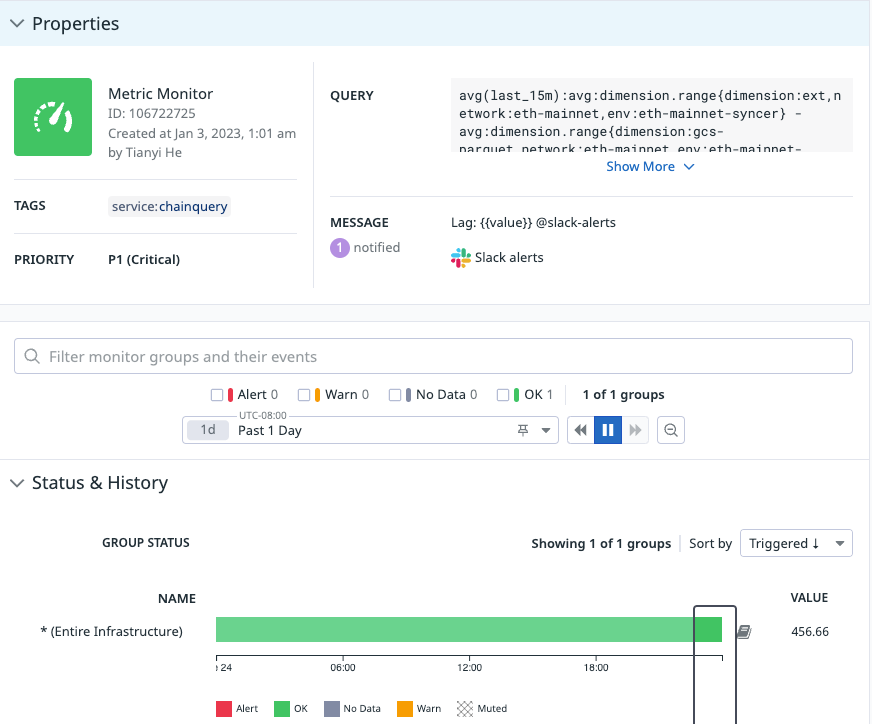
Conclusion
----------
At Sentio, we place a strong emphasis on testing to ensure the correctness and performance of our system. We employ a wide range of tests and monitoring to ensure that our system is functioning properly. We hope that this article has provided valuable insights and can assist in building a robust testing system for your blockchain storage system.
A Little About Sentio
---------------------
[Sentio](https://twitter.com/sentioxyz) is an observability platform for Web3. Sentio generates metrics, logs, and traces from existing smart contracts data through our low code solution, which could be used to build dashboards, set up alerts, analyze user behaviors, create API/Webhooks, simulate/debug transactions and more. Sentio supports Ethereum, BSC, Polygon, Solana, and Aptos. Sentio is built by veteran engineers from Google, Linkedin, Microsoft and TikTok, and backed by top investors like Lightspeed Venture Partners, Hashkey Capital and Canonical Crypto.
Visit Sentio at [sentio.xyz](http://sentio.xyz). Follow us on [Twitter](https://twitter.com/sentioxyz) for more updates.
Appendix: Common Steps for Testing Storage Infrastructure
---------------------------------------------------------
Unit Tests
----------
Early detection of issues is crucial for efficient problem-solving. Unit tests serve as the initial line of defense against bugs and other problems. These tests, written and executed by the developer, examine the smallest units of code, typically functions or methods. While some may argue that unit tests are unnecessary, they are vital for ensuring code quality and integrity.
* Unit tests serve not only as a means of detecting issues, but also as a valuable **documentation tool**. They document the expected behavior of the code, making it easier for others to understand and utilize. By reading the unit tests, one can gain insight into how the code should behave, providing a clear and concise understanding of its functionality.
* Unit tests provide a safeguard against regression, which occurs when a bug is introduced into the code and causes unexpected behavior. By running unit tests, regressions can be identified and prevented from being incorporated into the code, ensuring that the code behaves as intended.
There are a few more things regarding advanced unit tests:
* Testing against external resources, such as _remote procedure calls (RPCs)_ and databases, is a common practice. To ensure accurate testing, it is important to utilize mocking of these external resources. This allows for testing the code in isolation, without interference from external factors, and provides more reliable and consistent results.
* Testing asynchronous or multithreaded code can present challenges due to the possibility of non-deterministic results. Two common approaches for testing such code include:
* **Thread sanitizer**: One method for testing asynchronous code is to use a thread sanitizer. This tool can detect issues related to race-conditions and provide valuable insights for resolving them.
* **Test interceptor**: Another obstacle that can arise when testing asynchronous or multithreaded code is non-determinacy in the order of execution. A solution to this problem is the use of a test interceptor, which can intercept the execution of the code and ensure that it runs in the expected order.
* Memory or address issues refer to accessing invalid memory, which can be difficult to detect due to their non-deterministic nature. Utilizing a memory or address sanitizer can aid in identifying such issues.
Finding that writing unit tests is difficult and complex can often indicate that the code is not well-designed. In such cases, it is essential to refactor the code to make it more testable. To prevent the introduction of obvious issues, unit tests are typically configured to run before code is committed. This approach ensures that the code is thoroughly tested and of high quality.
Integration Tests
-----------------
Unit tests examine code in isolation, but integration tests take it a step further by evaluating how the code functions within the context of the entire system. This is achieved by testing the code using real remote procedure calls (RPCs) and real clusters. While the workload generated during integration testing is simpler and easier to debug, it is still far from the real-world scenario. Integration tests are usually scheduled to run after code is committed, or at regular intervals such as hourly. This is because they are more resource-intensive and may not be feasible to run before every commit.
Simulation/Randomized Tests
---------------------------
Simulation tests are considered the most challenging type of tests to write. It is important to note that they also require significant effort from developers to maintain them. Application developers may not choose to implement such tests if the system is not complex enough to justify the effort. However, many infrastructure systems, such as Google Spanner and Apple Foundation DB, have this type of tests in place, particularly for storage systems. This is a clear indication of their importance and value.
* On the write path, a randomized workload is generated and the transaction logs along with their commit timestamps are retrieved. This workload is then replayed against the storage system to ensure that the results match.
* On the read path, a randomized (but valid) abstract syntax tree (AST) is generated. Complex query optimizations are bypassed and a simple query execution engine is implemented. This engine prioritizes correctness over performance. The query is then executed against the storage system and the results are compared to ensure consistency and accuracy.
* During the test runs, 2 operations are performed constantly:
* **Fault injection**: Faults are deliberately injected into the system to test its resilience. These may include simulating scenarios such as temporary loss of a dependency. The system is then evaluated to ensure that it can continue to function properly even in adverse conditions.
* **Upgrade/Rollback**: A key aspect of testing infrastructure systems is simulating system upgrades and rollbacks. This helps to ensure that the system’s logic can handle such scenarios and is robust enough to survive rolling upgrades, which are a common occurrence in real-world environments.
It is important to note that real-world systems are significantly more intricate than those described above. However, through experience, it has been determined that these testing methods are the most effective at identifying bugs. The complexity of these systems can make it challenging for humans to fully understand and make it difficult to write deterministic tests for them. Simulation tests are typically scheduled to run periodically, such as every day. Multiple sets of simulation tests may be used to test different configurations.
Compatibility Tests
-------------------
Client libraries often need to support legacy versions for an extended period, such as 18 months. A common approach for testing these libraries is to create a matrix of all supported versions and test all possible combinations. These tests, which are typically integration tests, ensure that the client libraries are compatible with the server. To ensure compatibility and ensure that the client libraries are compatible with the server, these tests should be run periodically, such as every few hours, and automatically build the most recent commits.
Load Tests and Profiling
------------------------
Load tests are utilized to evaluate the performance of a system and detect performance regressions. This is typically achieved by generating a workload and measuring the system’s performance, either on a regular basis or before each release to the production environment. If a performance regression is detected, profiling tools can be used to identify the underlying cause. Two common types of profiling are:
* **CPU profiling**: It is used to identify the hotspots in the code. You could see where it is spending most of the CPU cycles.
* **Memory profiling**: It is used to identify the memory usage. It is quite useful to debug memory leaks or OOM (out-of-memory) issues.
Release Testing
---------------
Release testing is a critical step that is carried out before each release to the production environment. It ensures that the system is thoroughly tested and ready to be deployed. This testing process typically includes all the tests mentioned above, and is essential in ensuring that the system is stable and reliable.
Production Monitoring
---------------------
The distinction between testing and monitoring becomes less clear at this stage. While it is not strictly testing, monitoring is an important step in ensuring the reliability and stability of the system. Traditional testing methods, such as randomized tests, may not be able to detect all issues, as the workloads used may not be realistic enough. Monitoring involves collecting metrics, logs, traces, and alerts from the production environment and analyzing them to identify potential issues. In our experience, this approach is effective in identifying issues before they impact the users, as it allows for setting up alerts on deeper service objectives.
Avoid Regression
----------------
This step is often overlooked but is crucial for making consistent progress. Once a bug is detected and fixed through production monitoring, a test should be implemented to prevent it from recurring. As issues may be difficult to reproduce, particularly in the case of asynchronous systems, test interceptors can be used to force a specific execution order and make it deterministic. This feedback loop ensures that the system is continuously improving and that bugs are less likely to occur in the future.
---
# Blockchain Data: Time Series or Relational? Uncovering the Best Solutions by Use Cases
Source: https://www.sentio.xyz/blog/blockchain-data-time-series-or-relational/
Published: 2023-01-19
Authors: [Kan Qiao](https://twitter.com/qiaokan) at [Sentio XYZ](https://twitter.com/sentioxyz)
TLDR;
-----
* Generally, Time series data is more suitable for real-time monitoring, such as in DevOps, while relational databases are better suited for analytics use cases.
* Time series DBs make simple/time range related query/computation really fast, but often have issues with a large cardinality of labels.
* In crypto use cases, there is a significant overlap between monitoring and business analytics.
Introduction
------------
Common data-related tasks are typically accomplished by storing data within designated storage systems.
A widely used example of data storage is using a relational database management system, which can be further classified as OLAP (online analytical processing) and OLTP (online transactional processing). For instance, BigQuery and Snowflake are both well-known for their ability to handle analytical and data science workloads, such as finding out the top-selling products by month across different sales regions. On the other hand, systems like Oracle, SQL Server and Spanner are recognized for handling transactional workloads, such as processing bank transactions.
A Time Series Database is specifically designed to handle time-stamped data, also known as time series data. These data consist of measurements or events that are tracked, monitored, downsampled, and aggregated over time. Examples include server metrics, application performance monitoring, network telemetry, sensor data, events, clicks, and trades in a market, among many other types of data that will be used for analytical purposes.
This document focuses on the tradeoffs between these systems. To keep things simpler, it focuses on the use case of storing simple metrics (i.e. with numerical floating-point values) which are keyed by metric keys. Let’s dive into some more details.
Storage
-------
Data in relational databases are physically organized into rows and columns. Historically, databases were primarily row-oriented. With increasing demand of analytical workload, more systems are born as column-oriented.
Row-oriented storage is optimized for reading and writing individual rows of data, Often these systems are optimized for cases where one transaction reads, writes or modifies a single row. Conversely, column-based storage is more efficient for data compression, scanning large amounts of data, and joining columns, making it highly suitable for OLAP workloads. In a column-based architecture, a query usually reads/writes a group of rows.

Time series databases typically store data in chunks based on time intervals. This makes it very easy to scan through a specific range of data and allows users to easily remove old data or reduce the resolution of (often called ‘downsampling’) old data. The storage is often in the form of a key-value structure, where the key is a timestamp, and the value is a number (e.g. a float for a metric) or a string (e.g. for logs). In addition, users can also add labels to key-value pairs, to distinguish values (for example, coming from different sources), and often these labels are essentially dictionary-compressed by storing them in a different table, mapping these labels to simple numeric ids.

For example, to record the transaction volume of a blockchain protocol, where the protocol has _X_ tokens and runs on _Y_ different chains, this data could be recorded as:
```
txnVolume.record(volUSD, {“chain”: chain, “token”: token})
```
In this example, `chain` and `token` are labels. Note that every combination of `chain` and `token` becomes a time series and are stored somewhat separately in the database.
The total number of combinations of all labels is called the **cardinality** of the labels. Time-series databases often use encoding techniques, such as a global dictionary, to efficiently store multiple time series. This method involves replacing labels with an integer id and storing the id in the database, along with an entry in the dictionary that maps the id to the actual label.
It is not uncommon for a time series database to have a cardinality of millions or even billions of labels. Dictionary encoding effectively reduces the storage need if you happen to have labels that occur more than once throughout the database.
However, this is not always the case. Consider a typical scenario where you want to put user wallet addresses as labels. In this case, the cardinality of the labels is very large, and dictionary encoding is not very effective. We refer to scenarios like this as use cases with ‘large-cardinality’ labels, which causes issues even with modern time-series databases.
Query
-----
Users can write queries to perform analytical work on top of the storage system. Normally the query is compiled/converted following this path:
```
Query String -> AST (abstract syntax tree) -> Logical Plan -> Physical plan
```
Logical plan is a tree structure that represents how the query would be carried out logically, while physical plan is the actual operators that is executed by the database. A component within the database called the query optimizer is responsible for converting the logical plan into a physical plan. Suppose we are to find out the trade volume of each day, over the past 90 days. Logically, this can be done by grouping all trades by its day, then compute the sum of the volume, within each day. This is a typical job that can be represented with a logical plan, done by a query planner. This is how the logical plan would look like:
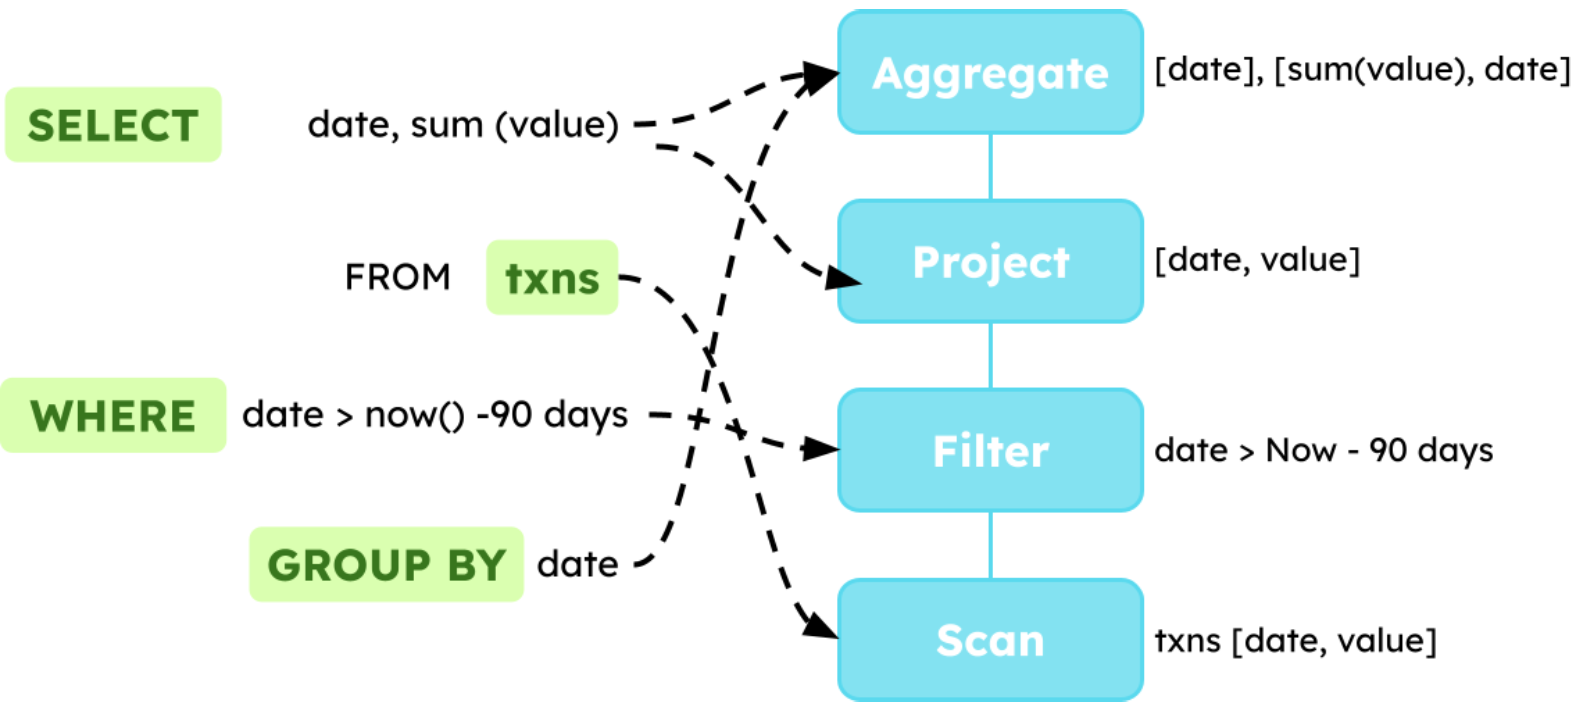
With the logical plan, the query optimizer can then choose the best physical plan to execute the query. One common optimization that a query optimizer would do is to choose hash join over other type of join operators, as the query optimizer knows that date would have a low cardinality (since we are taking only 90 days’ numbers). As you can see, problems arise when the cardinality is high, i.e. when we want to find out the trade volume of each wallet per day, where memory is insufficient to hold all state that is needed for computation. In this case, the intermediate state needs to be spilled to disk, which tends to be quite slow. Either a SQL database or a time-series database can perform said computation, though represented in different query languages, with different query plans. One great thing about time-series databases is that they can perform this computation very quickly, since the query pattern has a good way of taking full advantage of time-series data layout (neither sort nor join is necessary).
Query Languages
---------------
Relational databases typically use SQL as the main language (with different dialects of course), while time series databases use some form of specialized query language, like PromQL. One can perform join, scan, and aggregation either by SQL and PromQL, but they have quite some differences in flexibility and efficiency.
Query Semantics
---------------
SQL has a somewhat well-defined semantics, though different dialects vary slightly, you get exactly what you described in the query string. The time series query language, e.g. PromQL has a sampling concept builtin. For example, you need to specify a sampling step at query time. This is enough for users to see a trend with low query latency, for example discovering a big value change that sustained a given time period, but might surprise you on tasks that require extreme precision (e.g. locate one single/sparse data point).
For example, in Prometheus, you need to give a `lookback_delta` parameter at setup time. This is essentially the staleness of the data you are willing to accept. At query time, you need to specify:
* `start_time`: the start time of the query
* `end_time`: the end time of the query
* `step`: the sampling time-step. The system randomly samples a data point within each step.
The query will return a list of data points, where each data point is a tuple of `(timestamp, value)`. Because of the combination of `lookback_delta` and `step`, it is sometimes hard to locate a single data point.
Query Pattern v.s. Data Layout
------------------------------
SQL database workloads are categorized as OLAP and OLTP. Thus, column-oriented storage and row-oriented storage are designed to make the corresponding query perform better (in terms of both time and storage). Similarly, for time series use cases, the engines are optimized for timestamp-bounded range scan, and a limited set of aggregations within a time range. Therefore, the data is stored as timestamped chunks.
From these, we can understand that there is a **tradeoff between storage layout and query pattern**. We make conscious decisions to offload some query complexity to storage, thus making certain queries run more efficiently, while sacrificing performance of other queries (sometimes it is an **engineering priority** issue).
Comparing the 2 Systems
-----------------------
Simple Scan Queries
-------------------
To scan the data in a given range, or perform simple aggregations, time series databases are very efficient since the data are already stored together physically, like the example we walked you through in Query Section. You need much less IO operations to fetch the data and perform the computation than SQL databases.
Complex Join/Aggregation Queries
--------------------------------
SQL systems really spend a lot of effort optimizing flexible and general queries. Thus, they often perform better and more consistently than a time series database. One typical example is called ‘large cardinality’ aggregation. We have talked about what is large cardinality in the [Storage section](#storage). This is a very famous/common problem that exists in time series databases. This is often a big problem in the aggregation query, since most time series databases did not implement spooling (thus all the aggregations are done in memory) or efficient aggregation optimizations, while many SQL databases have many optimizations for this type of task.
It is worth noting that large cardinality is not only an issue for time series databases, it is very hard to solve in SQL databases too. It all comes down to SQL databases prioritize engineering effort to solve this type of problems, and also push a bunch of complexity to the storage layer of the system.
Data Retention/Sampling
-----------------------
When executing the query, PromQL execution engine has sampling directly builtin (so that data gets sampled automatically). SQL also has certain sampling functions, however, they need to be explicitly applied. A big advantage of time series DB is that it leverages the data layout to do retention. It is very easy to down sample or directly drop a complete chunk of old data.
Write performance
-----------------
Relational systems tend to use a B-Tree layout for data, giving consistent (but not amazing) write performance to any type of write workload (i.e. writing random rows vs writing sequential rows might not perform all that differently). Versus most time-series databases are optimized to write to many labels, but all at the same timestamp (i.e. current time), allowing the databases to essentially have a very efficient LSM (log-structured merge-tree) style write workload where data rarely (if ever) needs to be rewritten. However, if the write workload is different (i.e. every point is to a new label, or points are written to a wide variety of timestamps), then the performance will often be much worse.
Traditional Time Series Use Cases
---------------------------------
SQL databases are widely used for both analytical and transactional workloads. For time series databases, server metrics, application performance monitoring, network telemetry, sensor data, events, clicks, and trades in a market often are naturally timestamped.
Here is a sample dashboard:
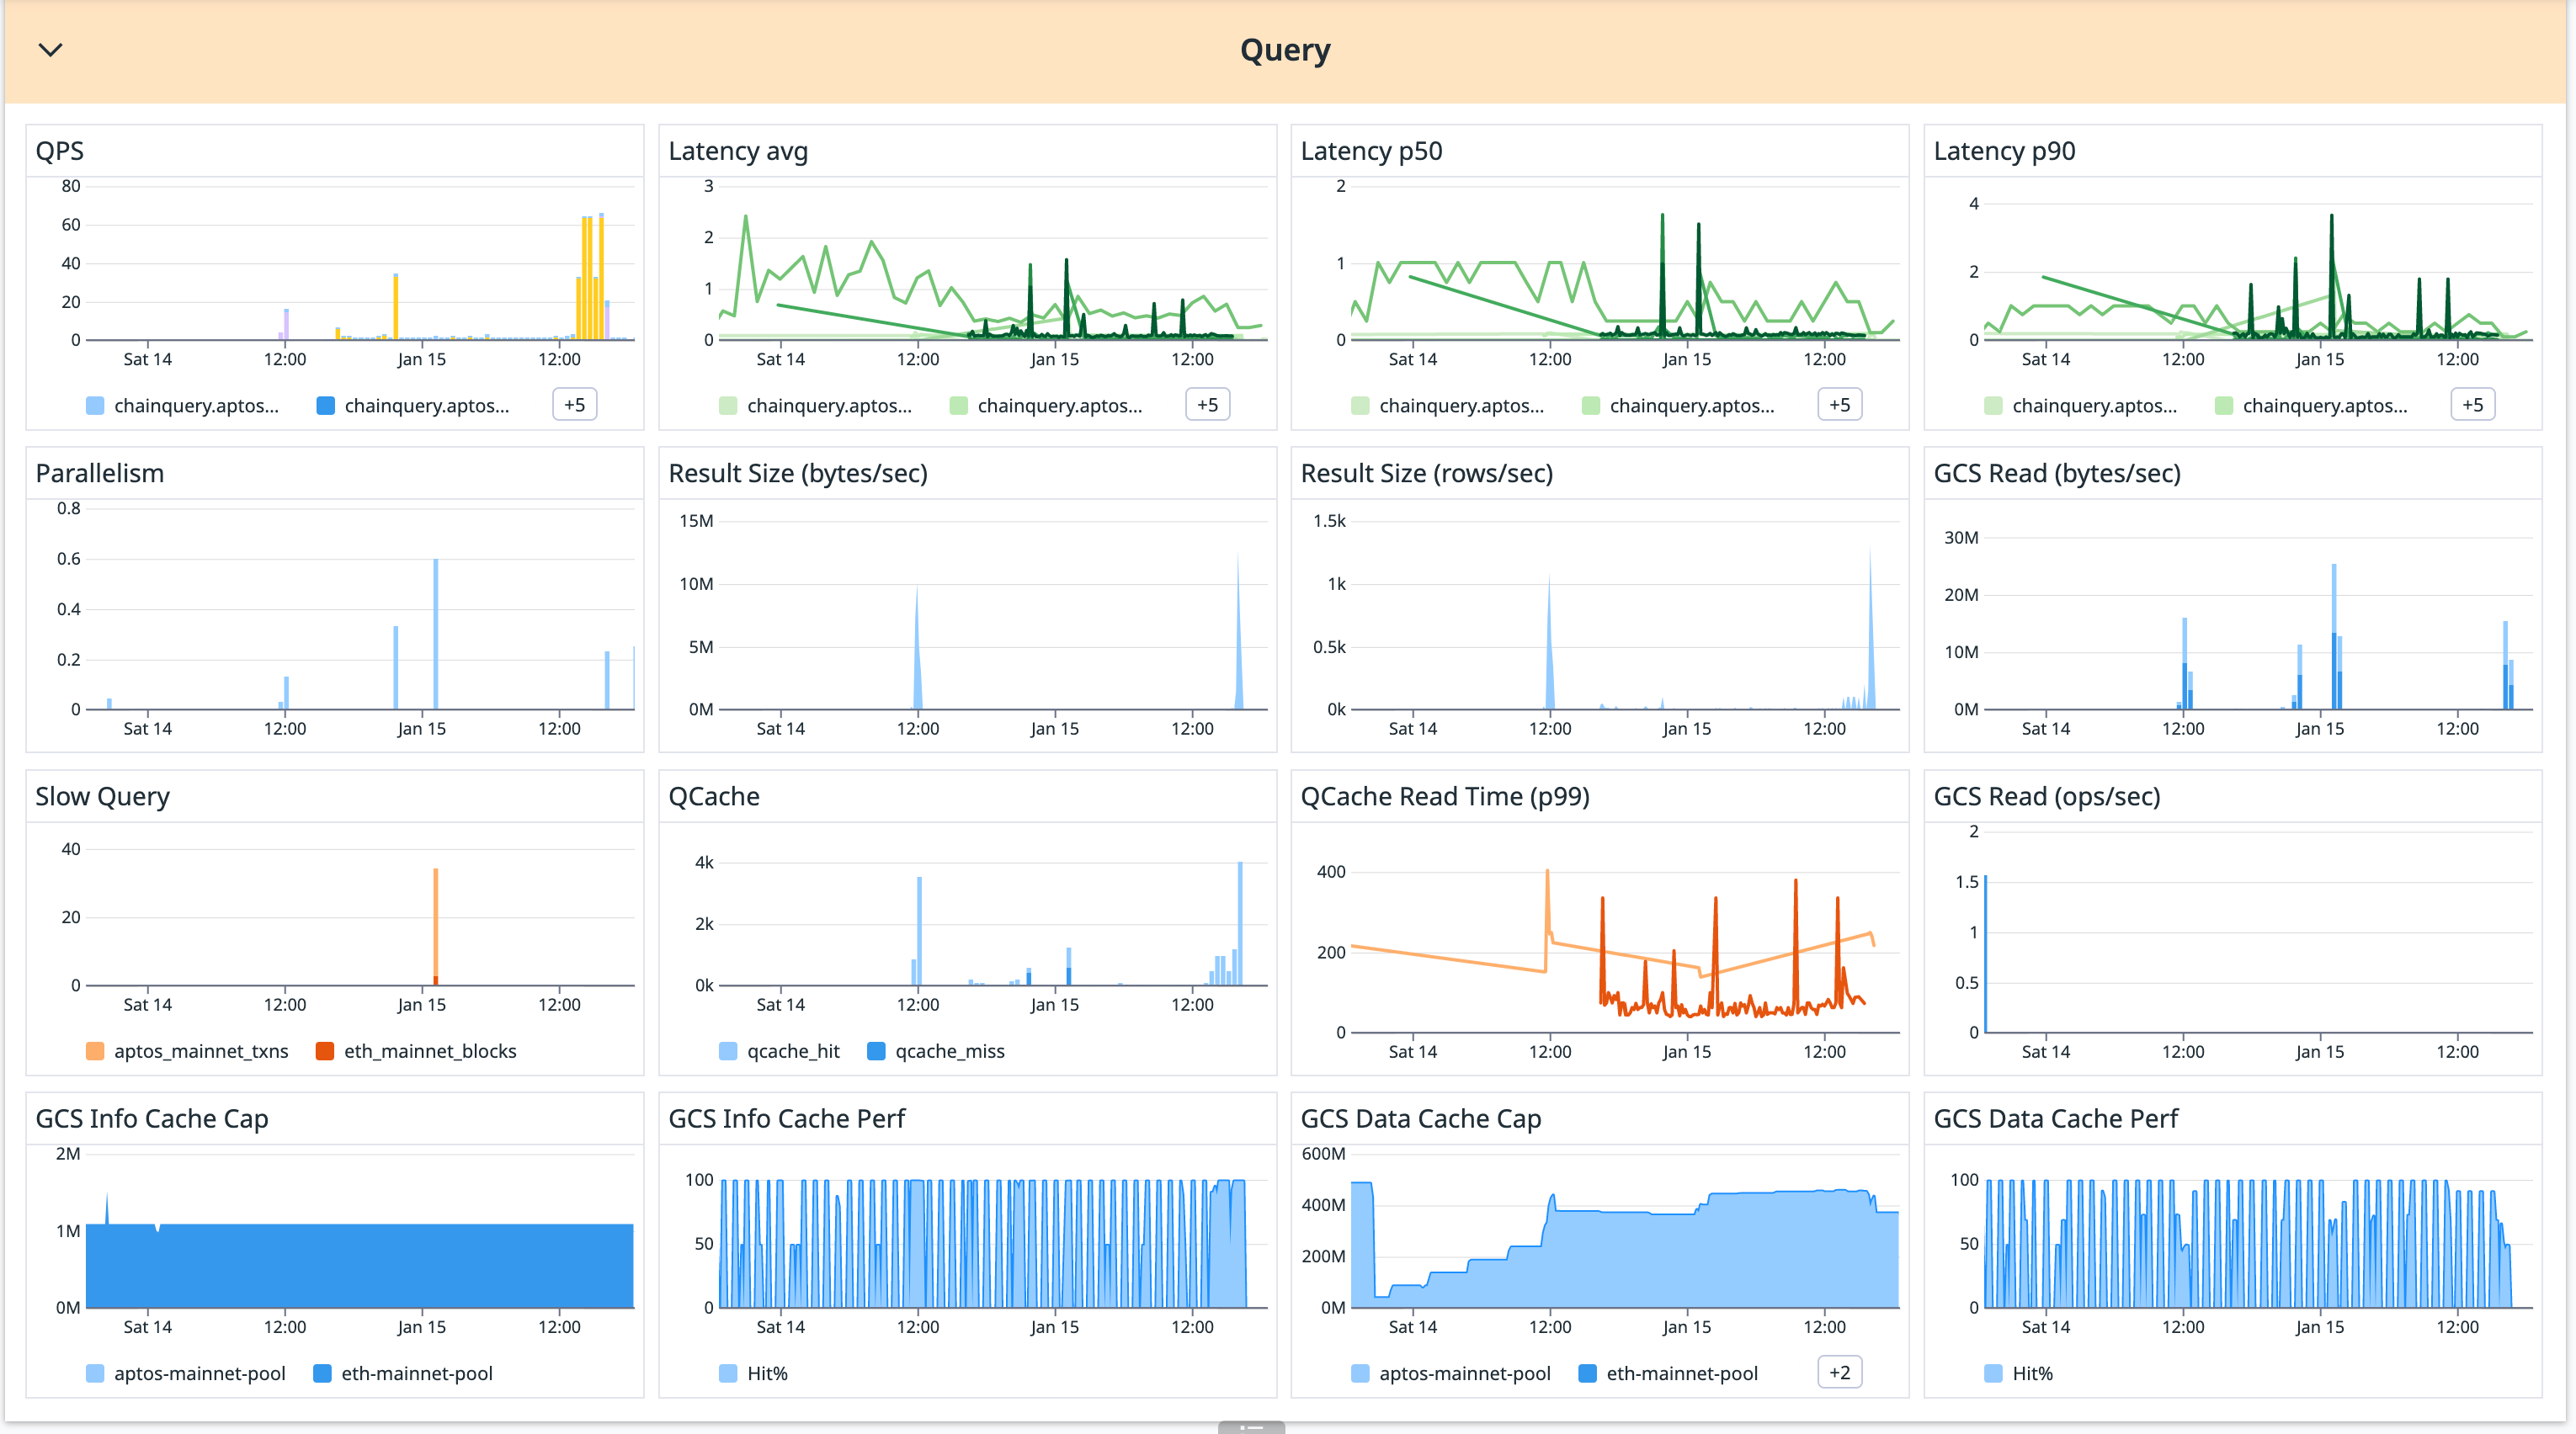
For modern DevOps and monitoring, alerts are often set up based on metrics. For example:
1. Alert when CPU or Memory usage is above a threshold.
2. 2\. Alert when the 99% latency is above 1 second.
3. 3\. Alert when the change rate over the last 5 mins is above 30%.
These are all perfect fit for time series databases. How about crypto/blockchain data?
Current Blockchain Data Infrastructure
--------------------------------------
Currently, most people put blockchain data into a SQL database. For example, there are tables for blocks, transactions, events, traces, etc. There might also be tables of decoded data for the top projects (Uniswap, Compound, etc). Here is an example of a possible table schema of blocks.
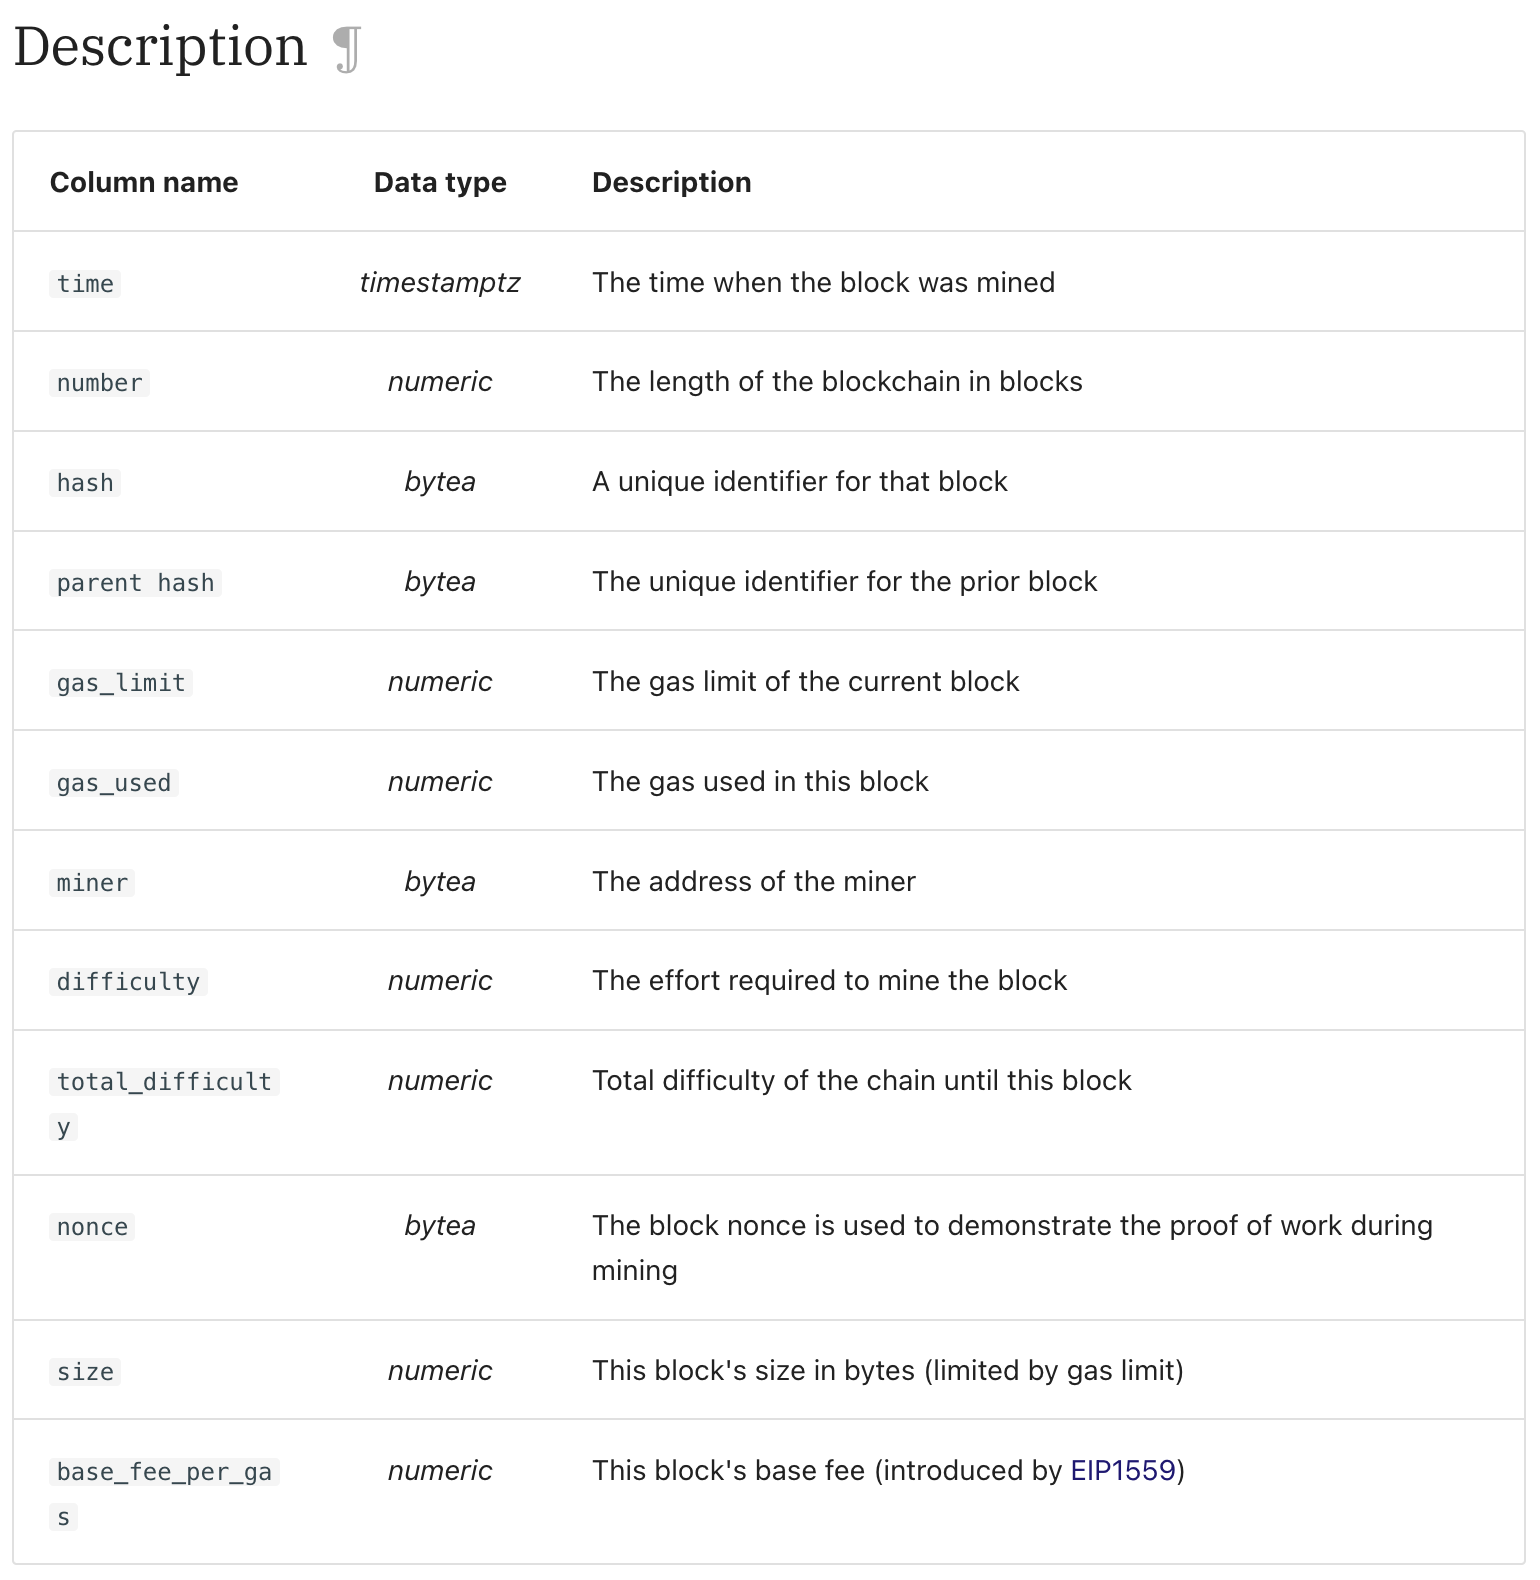
The true pioneer of this space is Dune Analytics. They built an easy-to-understand schema, clean visualization as well as a great community. There are also a few other companies who are approaching this problem from a similar angle. They might add a query interface of GraphQL, which is very convenient for frontend developers to query data.
Blockchain Data Case Studies
----------------------------
We will go over a few cases to determine which database system performs better.
Case 1: TVL (Total Value Locked)
--------------------------------
First, the most common use cases on Dune Analytics are computing TVL (total value locked). Here is one example of Dune dashboard to compute Loopring token balances (TVL). You can see token balances are a table of contents. It only captured the balance of the latest date.
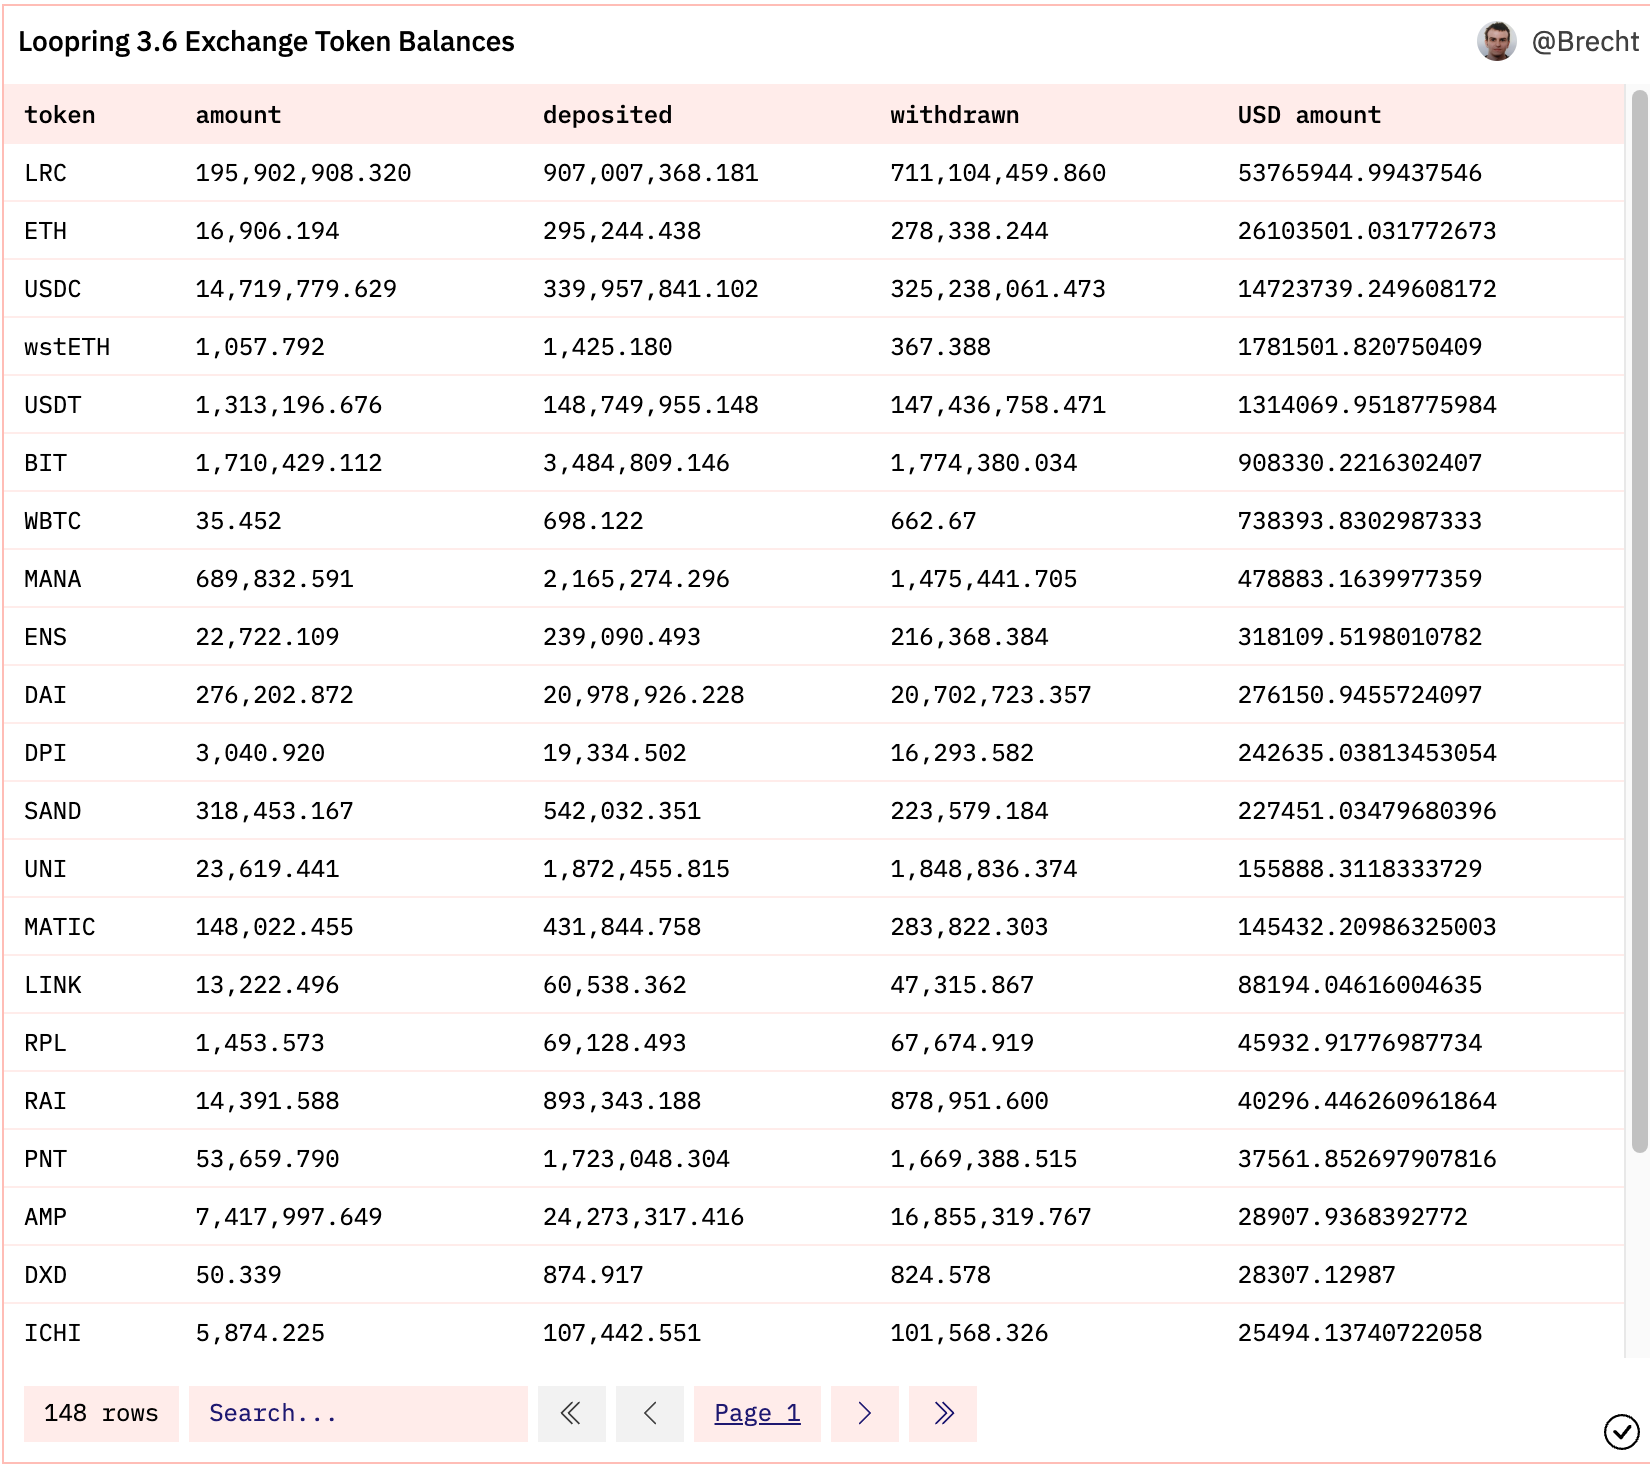
In fact, users might want to see the balance of a token changes over time. This is definitely doable in SQL databases. But it is not very efficient. You’d need either join the table with dates, or do a `window aggregation`.
However, if you use time series databases, you can directly store the data as you compute the balance over time. Then you can visualize it as a time series chart. Moreover, the latest data is instantly available.
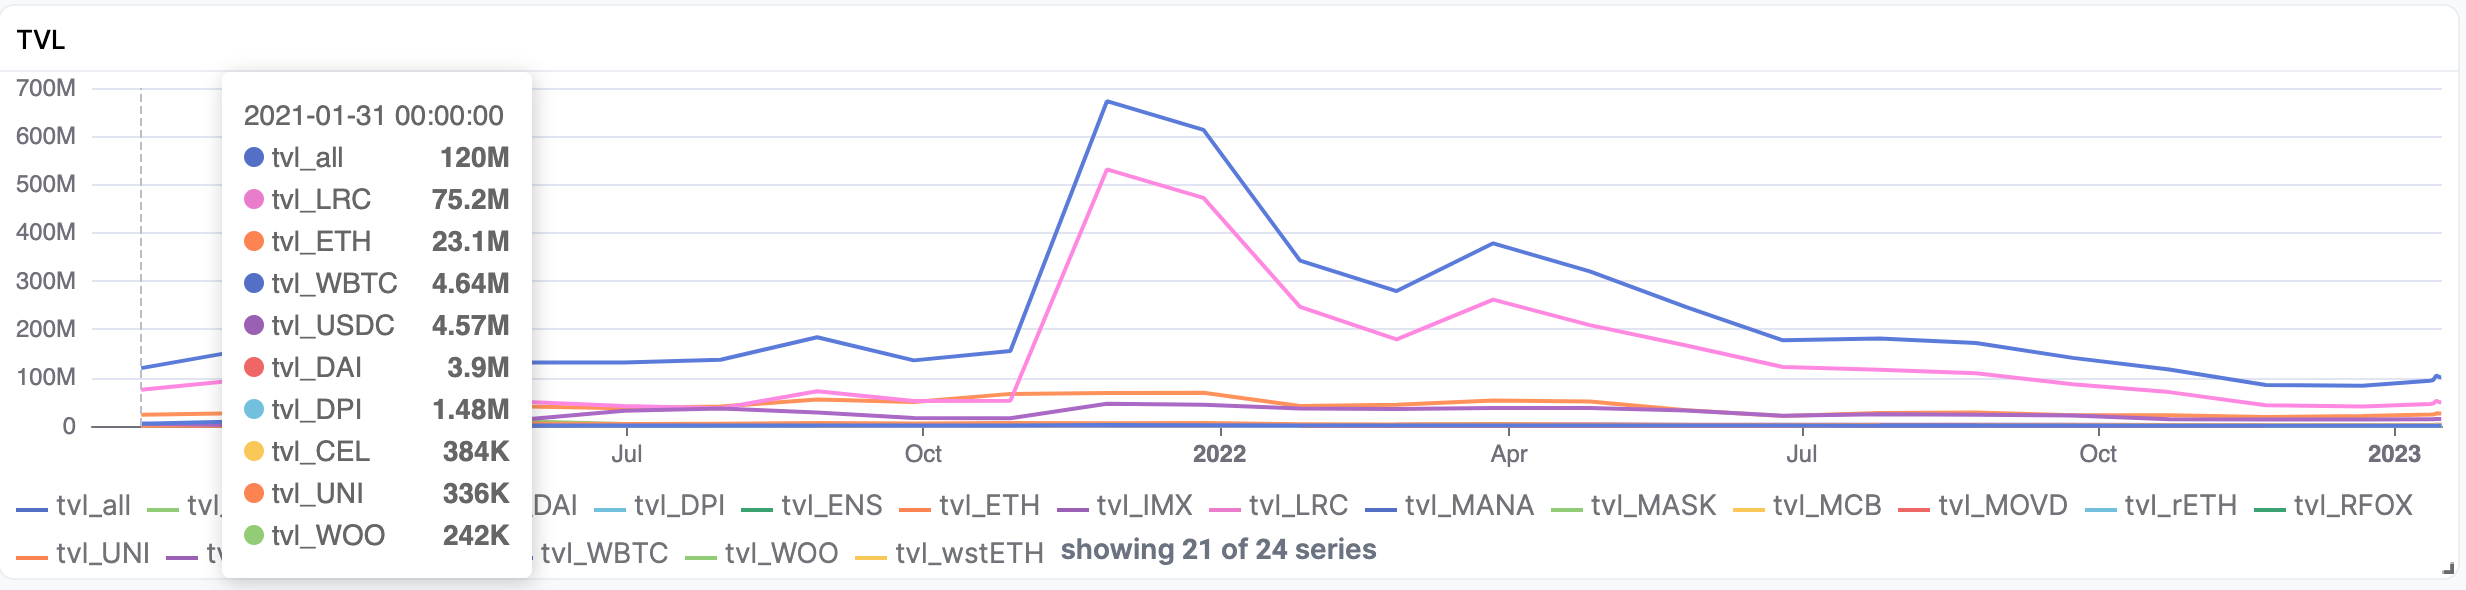
Case 2: Transaction Volume
--------------------------
There are 2 types of transaction volume.
Accumulative Transaction Volume
-------------------------------
Accumulative transaction volume, which is the total amount of transactions over time. Taking loopring’s total NFT minted, the Dune dashboard has a total number.
This has 2 issues
* Since it is aggregating all the historical data, it is very slow to compute since it must recompute transactions every time it runs the query, which can lead to timeouts. (**Using Dune Engine V2 can definitely mitigate the issue**)
* Similar to TVL computation, it is not very efficient to compute the cumulative volume. Time series databases can do it much more efficiently.
Transaction Volume of a Given Time Period
-----------------------------------------
This is also another common use case. Taking loopring’s deposit volume, dune dashboard has the deposits over the last 3 months. You probably noticed that the time range is fixed. (In theory, it is possible to make time range a parameter binding to control the time window, but it is not very convenient for users to do so)
Using time series databases, you get the benefits of viewing any given time range **with very low latency**
Case 3: Real-time Alert
-----------------------
This is another use case for time series databases to achieve the best performance. Say if you’d like to set up an alert when the trading volume of the last 5 mins is above a threshold. You would expect to get the alert instantly. Users need to set up an alert rule and the alert should be automatically triggered when the condition is met.
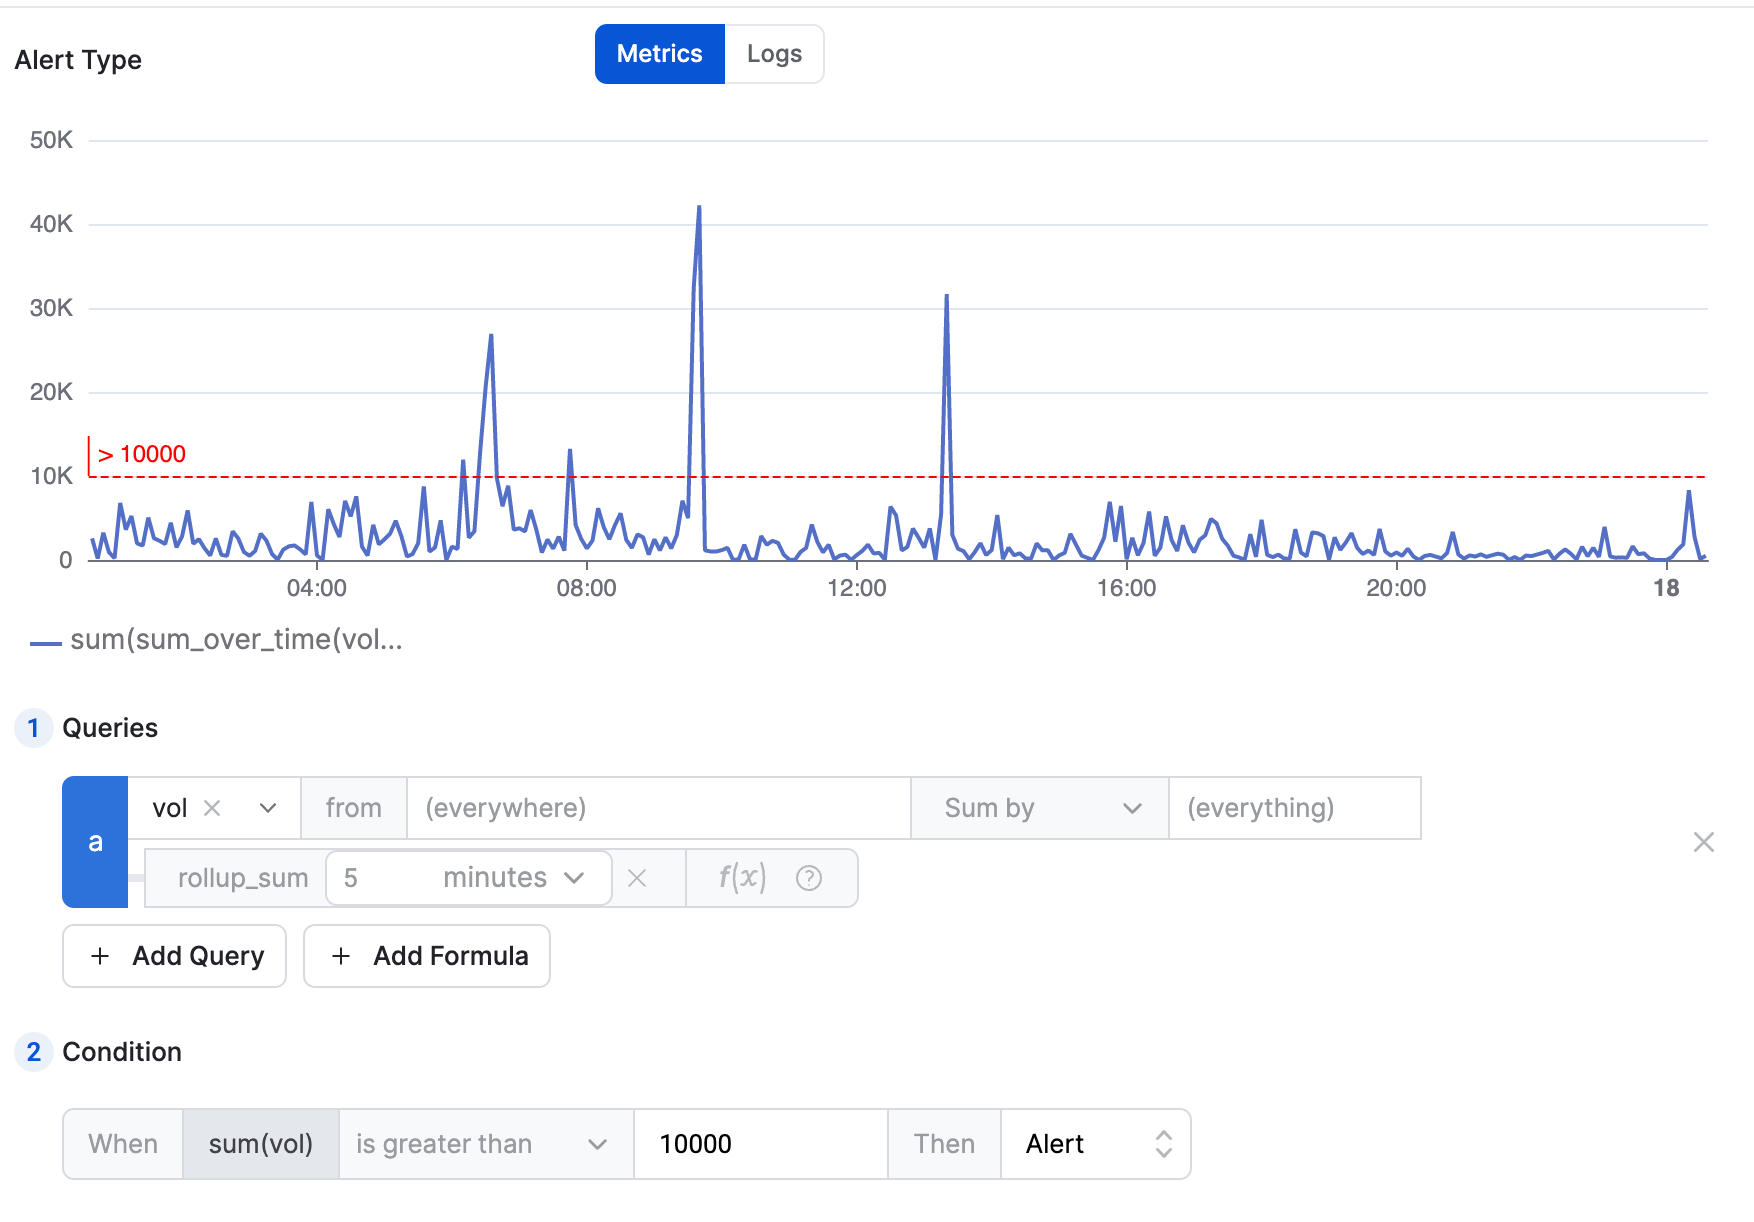
Case 4: Top Trading Users
-------------------------
Users might want to see the top trading users at the given time period. For this case, time series DB may not be the best choice even if it can solve this problem at a smaller scale. This is due to the large cardinality problem mentioned earlier.
A Little About Sentio
---------------------
Sentio is an observability platform for Web3. We are pushing the limits of both time series and relational databases and using them together to give great experiences to our users. Sentio generates metrics, logs, and traces from existing smart contracts data through our low code solution, which could be used to build dashboards, set up alerts, analyze user behaviors, create API/Webhooks, simulate/debug transactions and more. Sentio supports Ethereum, BSC, Polygon, Solana, and Aptos. Sentio is built by veteran engineers from Google, Linkedin, Microsoft and TikTok, and backed by top investors like Lightspeed Venture Partners, Hashkey Capital and Canonical Crypto.
Visit Sentio at [sentio.xyz](http://sentio.xyz). Follow us on [Twitter](https://twitter.com/sentioxyz) for more updates.
---
# Open Sourcing Sentio Composer — The Aptos View Function Simulator
Source: https://www.sentio.xyz/blog/open-sourcing-sentio-composer-the-aptos-view-function-simulator/
Published: 2022-12-02
Description: We are proud to announce the open sourcing of Sentio Composer, a view function simulator for the Aptos blockchain.
We are proud to announce the open sourcing of Sentio Composer, a view function simulator for the Aptos blockchain.
**Background**
==============
We have had the privilege to work with many top projects in the Aptos community since the mainnet launch in October. The lack of an easy way to simulate a read-only call against a function, especially against a historical version, has constantly been brought up as a pain point in development and debugging.
This is why we decided to give back to the Aptos community by building a library that enables developers to easily query a view function at any historical version, and open-source the entire project under Apache License.
**Github Repo**
===============
[https://github.com/sentioxyz/sentio-composer](https://github.com/sentioxyz/sentio-composer)
**Web Demo**
============
[http://composer.sentio.xyz/](http://composer.sentio.xyz/)
We also built a web demo with which you can try out the functionality. Please note the demo instance is not intended for production use. If you are interested in using the composer as a hosted service you can contact us at: [https://forms.gle/wKRVX529JarmDauG8](https://forms.gle/wKRVX529JarmDauG8)
**Implementation Details**
==========================
Sentio Composer is implemented based on Move VM and built-in native functions of Aptos. It will query the local cache or Aptos blockchain for the module it belongs to based on the input function ID, and then pass the resulting bytecode to the Move Virtual Machine. Move VM then executes the said function.
During function execution, the VM will also query its dependencies and resources. Sentio Composer queries this data from Aptos blocks via Aptos REST API. The function execution can take a while when being called for the first time, as the modules are not cached. When the function execution is completed, the execution result is collected from the VM return value. The whole process is shown in the figure below:
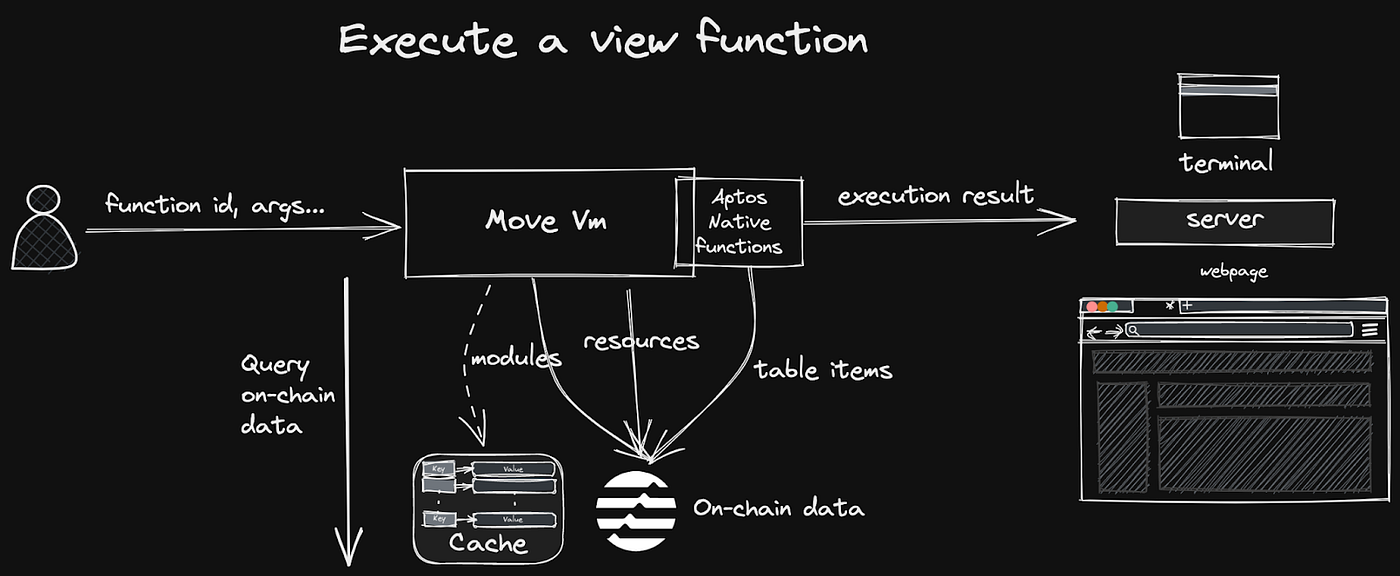
Although in principle the tool can be used to execute any function on Aptos, we do encourage the usage to be limited to view functions only, as 1) any side effect expected by calling a non-view function will not take effect on the blockchain obviously and 2) The tool itself will not return the result of the side effects.
Supported argument types
------------------------
The CLI takes string formatted arguments as the arguments of the view function. The following argument types are supported:
* bool literals (true, false)
* integer literals (e.g., 10, 58)
* address literals (e.g., 0x12, 0x0000000000000000000000000000000f)
* u8 vector, bytes string representation (e.g., foo)
API Specification
-----------------
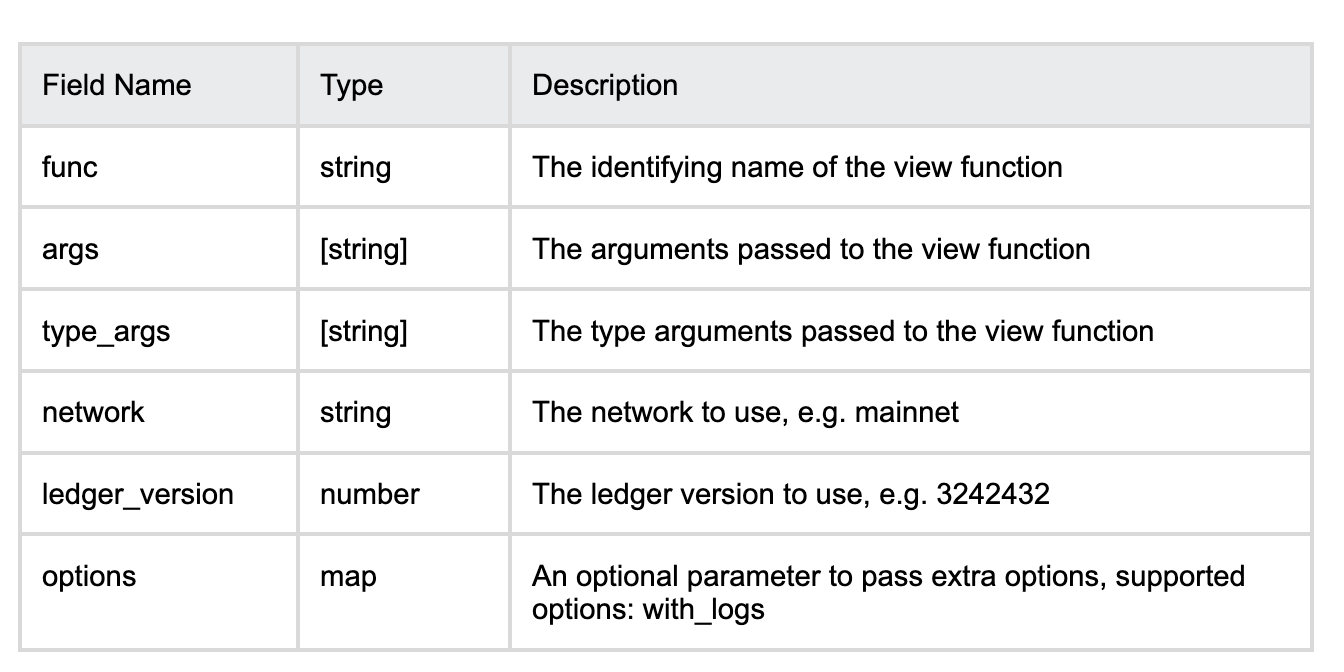
**About Sentio**
================
Sentio is an observability platform for Web3. Sentio generates metrics, logs, and traces from existing smart contracts data through our low code solution, which could be used to build dashboards, set up alerts, analyze user behaviors, create API/Webhooks, and more. Sentio supports Ethereum, BSC, Polygon, Solana, and Aptos.
Sentio is built by veteran engineers from Google, Linkedin, Microsoft and TikTok, and backed by top investors like Lightspeed Venture Partners, Hashkey Capital and Canonical Crypto.
We are currently in closed beta. Follow us on [**Twitter**](https://twitter.com/sentioxyz) for more updates. Contact us at: [**https://forms.gle/wKRVX529JarmDauG8**](https://forms.gle/wKRVX529JarmDauG8) if you want to work with us.
